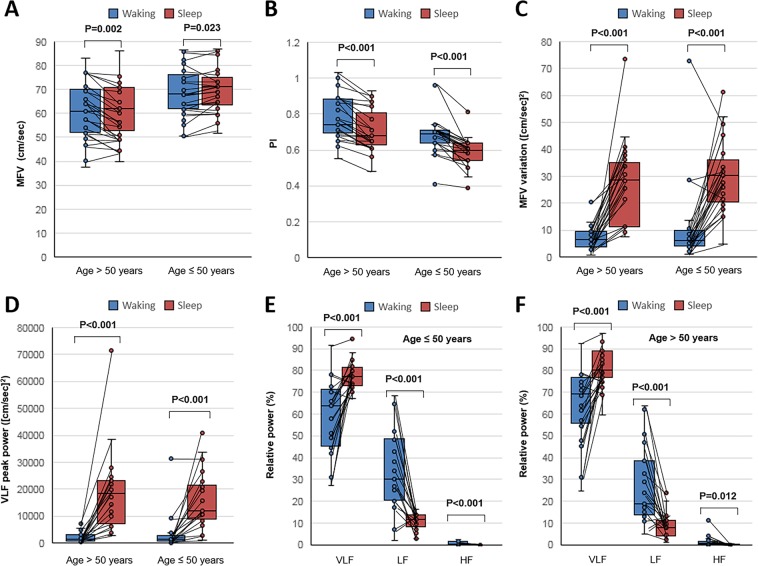
Figure 1.
Comparison of flow velocity parameters between the waking and sleep stages. Subjects were divided into two subgroups according to age (≤50 and >50 years). In each subgroup, the mean flow velocity (MFV) increased (panel A), the pulsatility index (PI) decreased (panel B), the variance of MFV increased (panel C), and the absolute power of the peak in the very-low–frequency (VLF) band (panel D) and the relative power of the VLF band in the spectral density analysis (panels E and F) significantly increased during the sleep status, compared to the waking status. The sleep/waking ratios of these parameters were not significantly different between the age subgroups. Horizontal lines above the bars denote standard errors. Abbreviations: ULF, ultra-low frequency; LF, low frequency; HF, high frequency.

