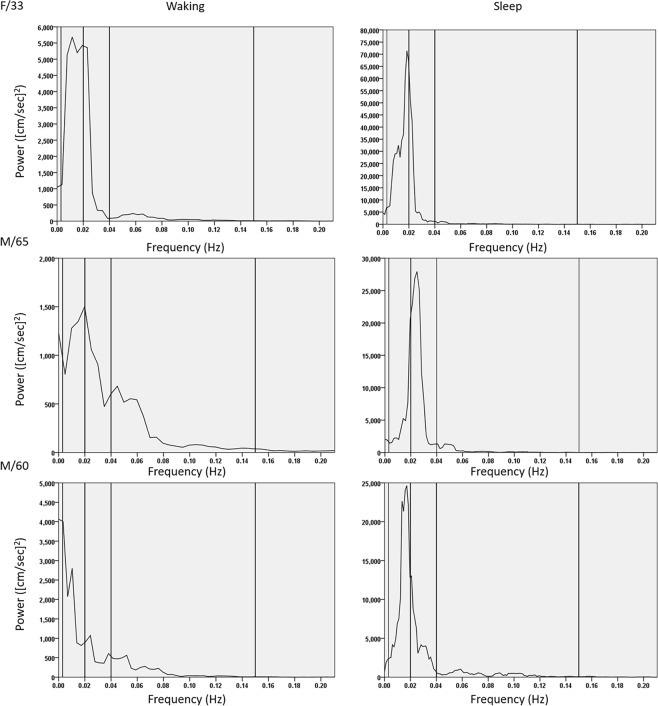
Figure 3.
Spectral density analysis of the mean flow velocity: Representative cases. To analyze the periodic component of the mean flow velocity (MFV) variation, a fast Fourier transformation was applied and the graphs of spectral density according to the frequency domain were drawn for a 33-year-old woman (upper panel), a 65-year-old man (middle panel), and a 60-year-old man (lower panel). As the result, a peak was observed in the very-low–frequency (VLF, 0.003–0.04 Hz) band during the sleep status (right panels), which was not prominent during the waking status (left panels).

