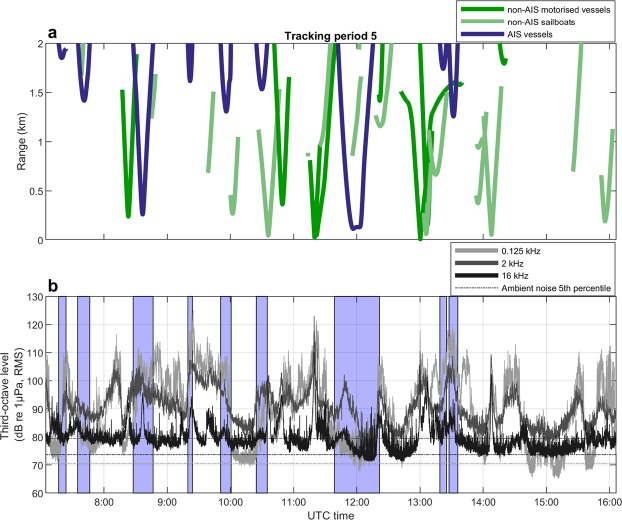
Figure 2.
Vessel tracks and underwater noise levels. (a) Vessel tracks of AIS (blue) and non-AIS vessels (green) within the study area during one tracking period together with (b) recorded underwater noise levels at the three selected frequency bands 0.125, 2 and 16 kHz over the same time. Ambient noise levels calculated as 5th percentiles over the entire study period are plotted as dashed coloured lines in (b) with values shown on the right side of the plot. Time periods on (b), marked with blue shaded areas, indicate times at which an AIS vessel was present according to vessel tracks shown in (a).

