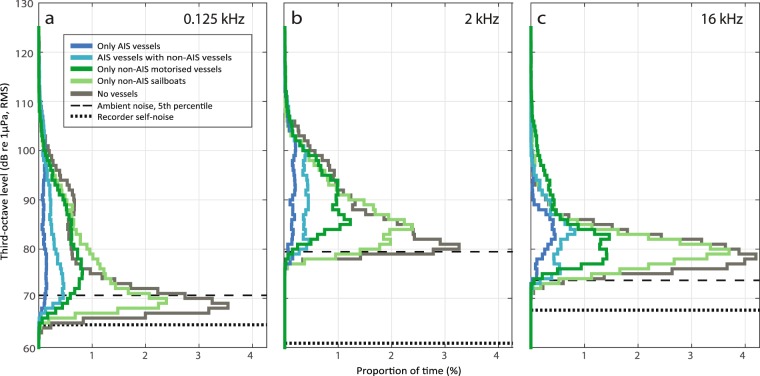
Figure 4.
Histograms of recorded noise levels during presence of different vessel types. Subplots show recorded noise in third-octave bands centred at (a) 0.125 kHz, (b) 2 kHz and (c) 16 kHz. Colours represent times with only AIS vessels present (dark blue), both AIS and non-AIS vessels present (light blue), only non-AIS vessels present with at least one being motorised (dark green), only non-AIS sailboats present (light green) or no vessels present (grey). The x-axis shows the proportion of the time (%) that each third-octave band level (1 dB intervals from 60 to 130 dB re 1µPa, RMS) occurs within each group. Ambient noise (5th percentile) is plotted as dashed horizontal lines.

