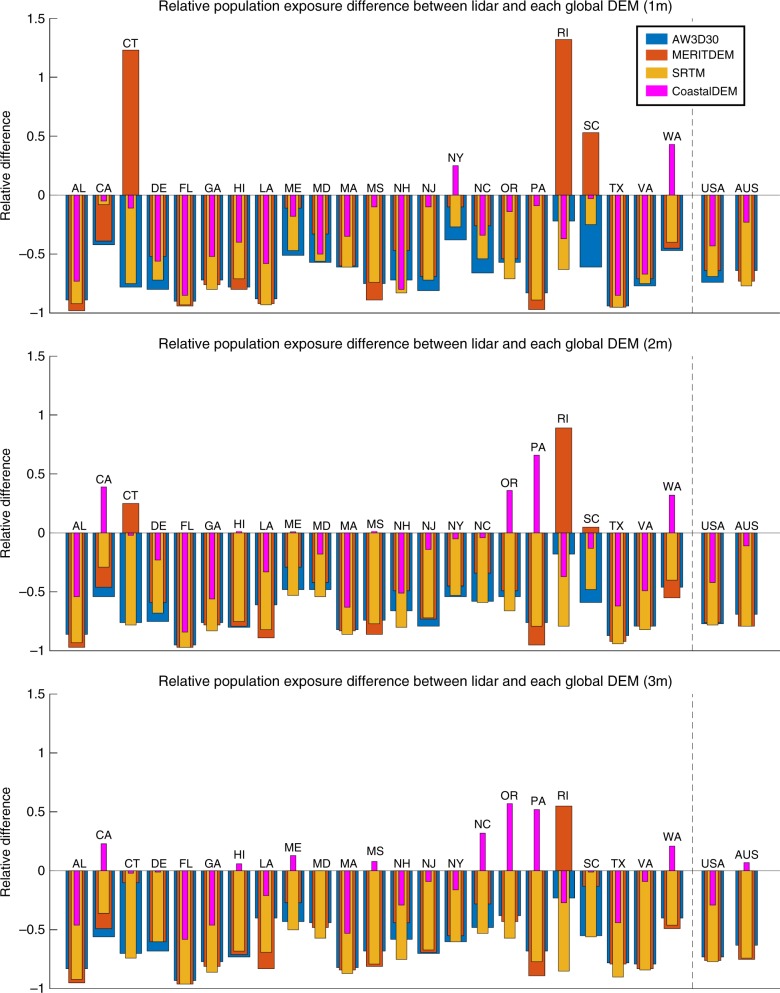
Fig. 4.
The relative difference of computed population ECWL exposure between lidar and four global DEMs. Populations living on land below 1, 2, and 3 m are computed in the US and Australia with each DEM. Zero relative differences indicate both lidar and the given global DEM predict the same number of people below the elevation threshold whereas, for example, −0.5 and 0.5 would indicate that the global DEM underestimation or overestimated by 50%, respectively. Results are given for each US state, as well as at the national scale in the US and Australia. Source data are provided as a Source Data file

