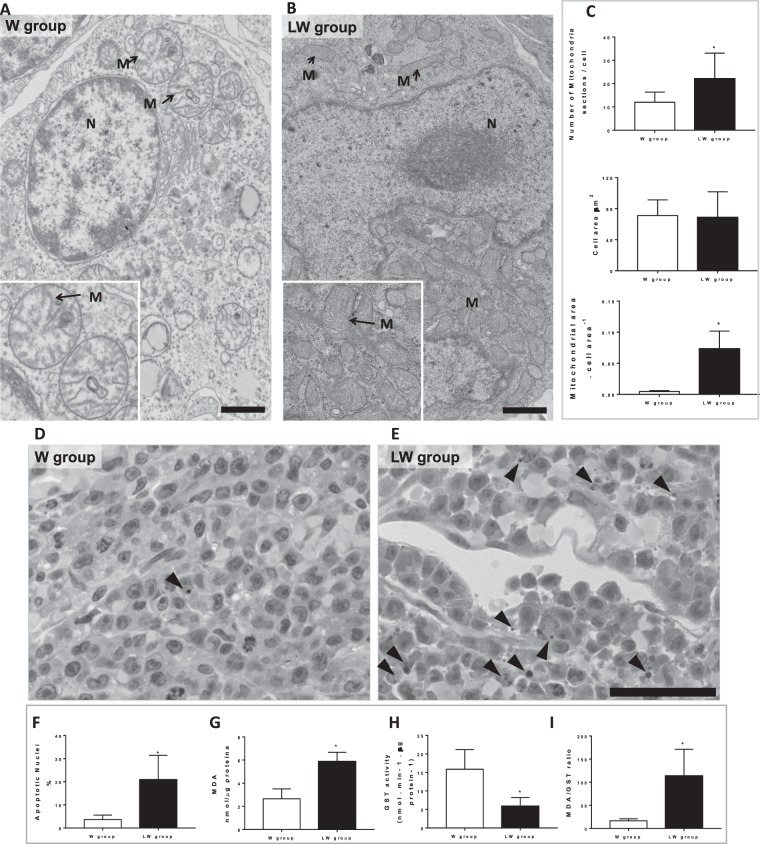
Figure 4.
Leucine-rich diet led to mitochondrial biogenesis in Walker-256 tumour tissue. (A,B) Representative transmission electron microscopy (TEM) micrographs of Walker-256 tumour from animals fed a control diet (W group) and a leucine-rich diet (LW group); details show the cristae (arrow) of the mitochondria in each group. N = 3 animals per group. N = nuclei; M = mitochondria. Scale bar = 2 μm. (C) Graphics of an average number of mitochondrial sections per cell, average cell area (µm2), and average mitochondrial area per cell area (analysis accessed from counting from minimal 10 cells per animal from each group). (D,E) Representative photomicrographs of W and LW tumour groups. Observe apoptotic nucleus (head arrows). Scale bar = 50 μm. N = 3 animals per each group. (F)– Graphs of apoptotic nuclei (%) of W and LW tumour accessed by haematoxylin and eosin staining (analysis counting used 20 different areas from 3 animals per each group). (G–I) Representative analyses of malondialdehyde (MDA) content, glutathione-S-transferase (GST) activity, and the MDA/GST ratio from tumours of the W and LW groups. N = minimum of eight animals per group. For further details see the Material and Methods section. Values are means ± standard deviation. *P < 0.05 compared to W (Student’s t-test).

