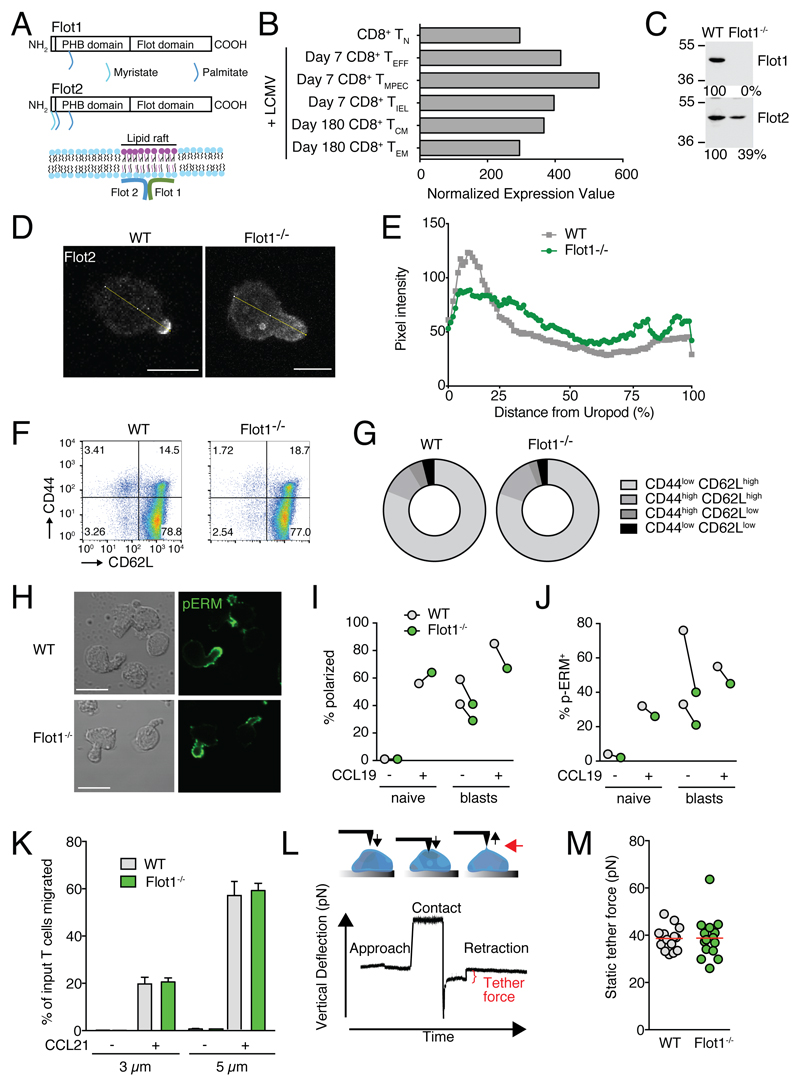
Figure 1. In vitro characterization of Flot1-/- T cells.
A. Scheme of Flot1 and Flot2 protein domains and association with lipid raft microdomains. PHB, prohibitin homology domain. B. RNA-seq data of Flot1 expression in CD8+ T cells (from Immgen database). C. Expression of Flot1 and Flot2 in T-lymphoblasts isolated from spleens of wild type and Flot1-/- mice. D. Immunofluorescent images of WT and Flot1-/- T cells stimulated with CCL21 and stained for Flot2. Yellow line depicts fluorescence intensity assessment. Scale bar, 5 μm. E. Flot2 pixel intensity per cell normalized to distance from uropod. n = 26 and 21 for WT and Flot1-/- T cells, respectively. F. Flow cytometry plot of CD62L and CD44 expression on splenic CD8+ T cells. G. Quantification of surface expression of CD44 and CD62L on CD8+ T cells from WT and Flot1-/- mice. Pooled from 2 independent experiments, n = 4. H. Phase contrast and immunofluorescent images of polarized activated WT and Flot1-/- T cell blasts stimulated with CCL19 and stained for pERM. Scale bar, 10 μm. I, J. Quantification of polarization (I) and pERM capping (J) of naïve and activated T cells with and without CCL19 stimulation. K. Chemotaxis of naïve WT and Flot1-/- T cells towards 100 nM CCL21 through 3 and 5 μm filters. Shown is mean ± SD of one of two experiments performed in triplicates. L. Schematic of pulling static tethers with an atomic force microscope. M. Average static tether force per cell. Data shows one representative experiment of two.

