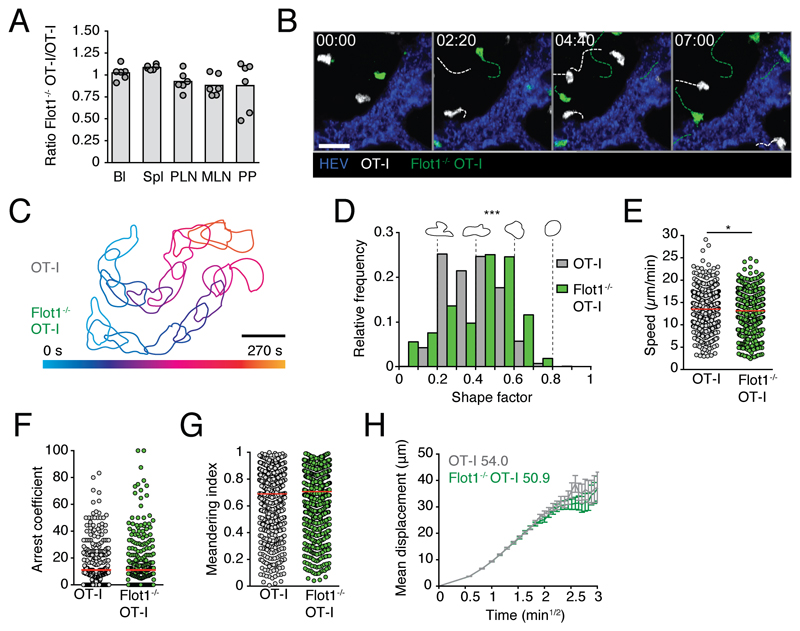
Figure 2. In vivo trafficking of naïve Flot1-/- CD8+ T cells in lymphoid organs.
A. 2 h in vivo homing of OT-I or Flot1-/- OT-I T cells to indicated organs: blood (Bl), spleen (Spl), peripheral lymph nodes (PLN), mesenteric lymph nodes (MLN) and Peyer’s patches (PP). Each dot represents organs from one mouse, bars depict mean. Pooled from 2 independent experiments with a total of 6 mice per group. B. 2PM image sequence of naive WT and Flot1-/- OT-I T cells migrating in popliteal LN. Dashed white and green lines indicate tracks of migrating WT and Flot1-/- OT-I T cells, respectively. Scale bar, 20 μm; Time in min:s. C. Representative time-coded outlines of migrating WT and Flot1-/- OT-I T cells. Scale bar, 10 μm. D. Shape factor of naive WT and Flot1-/- OT-I T cells migrating in popliteal LN. Pooled from 2 independent experiments with 3 mice per group. E-G. Speed (E), arrest coefficient (F) and meandering index (G) of naïve WT or Flot1-/- OT-I T cells migrating in popliteal LN. Red lines depict median, each dot represents the average value for an individual track. H. Mean displacement versus time for datasets in E-G. Numbers indicate motility coefficient in μm2/min. Data in E-H are pooled from 3 independent experiments with a total of 8 mice. Data in A were tested for significance with 2-way ANOVA and Sidak’s multiple comparison test. Data in E were analyzed using unpaired Student’s t-test, data in D, F and G using Mann-Whitney test. *, p < 0.05; ***, p < 0.001.

