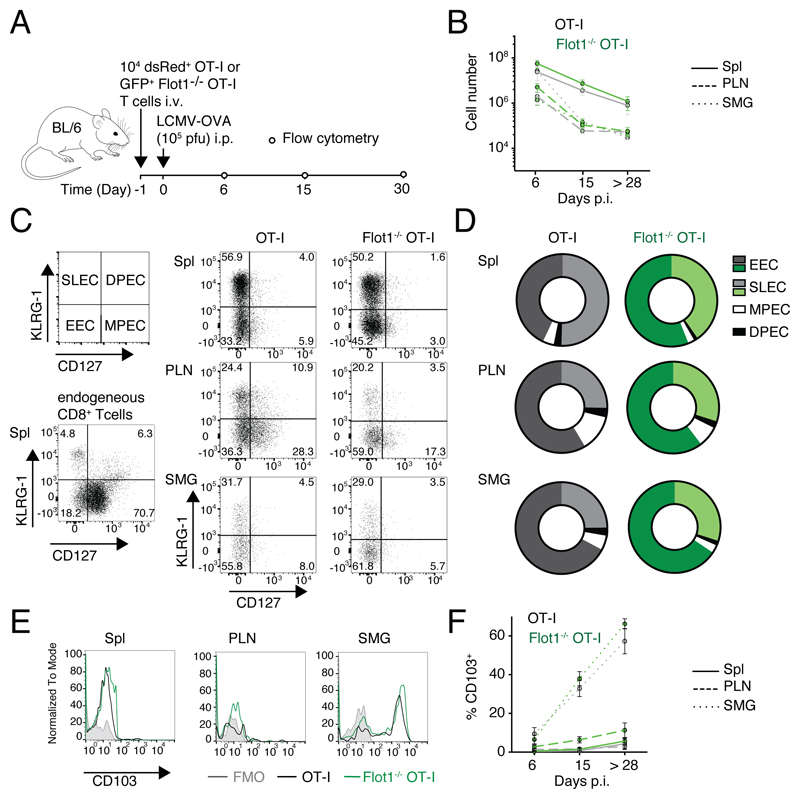
Figure 3. Expansion and memory formation of Flot1-/- CD8+ T cells.
A. Experimental layout of LCMV-OVA infection. B. Total number of GFP+ cell number in spleen (Spl), pooled peripheral lymph nodes (PLN) and submandibular salivary gland (SMG) at day 6, 15, and >28 p.i. Pooled from 2 independent experiments with a total of 5-6 mice per group. C, D. Representative flow cytometry plots (C) and pooled results (D) of CD127 and KLRG-1 co-staining of endogenous CD8+ and transferred OT-I T cells on 6 d p.i.. Pooled from 2 independent experiments and a total of 4-8 mice. E, F. Representative flow cytometry plots (E) and pooled results (F) of CD103 expression on OT-I and Flot1-/- OT-I T cells in memory phase (>28 days p.i.). F shows mean with SEM from 2-4 independent experiments with a total of 5-12 mice per group and time point.

