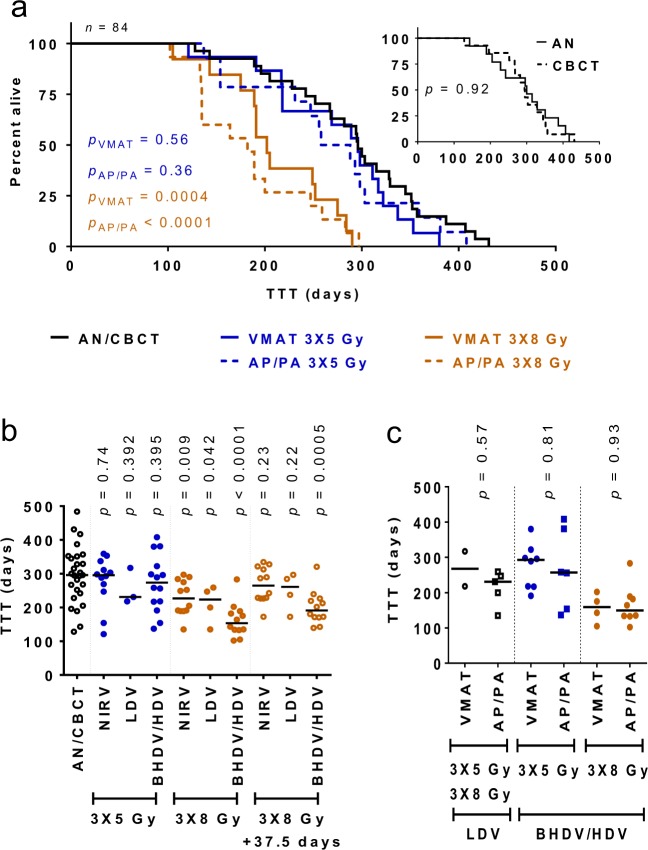
Figure 3.
Latency time of tumor development: (a) Kaplan-Meier curves showing the fraction of tumor-free animals as function of time after irradiation (or sham) for all animals that eventually developed a tumor (n = 84). The curves for the two control groups (AN and CBCT) were similar (p = 0.92; a, insert), but tumors developed significantly earlier after 3 × 8 Gy (VMAT: p = 0.0004, and AP/PA: p < 0.0001; Gehan-Breslow-Wilcoxon test; p < 0.05); (b) the median time to tumor (TTT) remained significantly reduced in the BHDV/HDV (p = 0.0005; Mann-Whitney U test) when the older age at treatment of the 3 × 8 Gy group (median 37.5 days) was considered; (c) no significant difference in the TTT for radiation-associated tumors (in LDV/BHDV/HDV) was observed between VMAT and AP/PA. Horizontal lines indicate median values. Abbreviations: TTT, time to tumor; AN, anesthesia only control group; CBCT, cone-beam computed tomography only control group; VMAT, volumetric-modulated arc therapy; AP/PA, anterior-posterior/posterior-anterior irradiation; Gy, Gray; NIRV, non-irradiated voume; LDV, low-dose volume; BHDV/HDV, bordering high-dose volume and high-dose volume combined.

