Fig. 4.

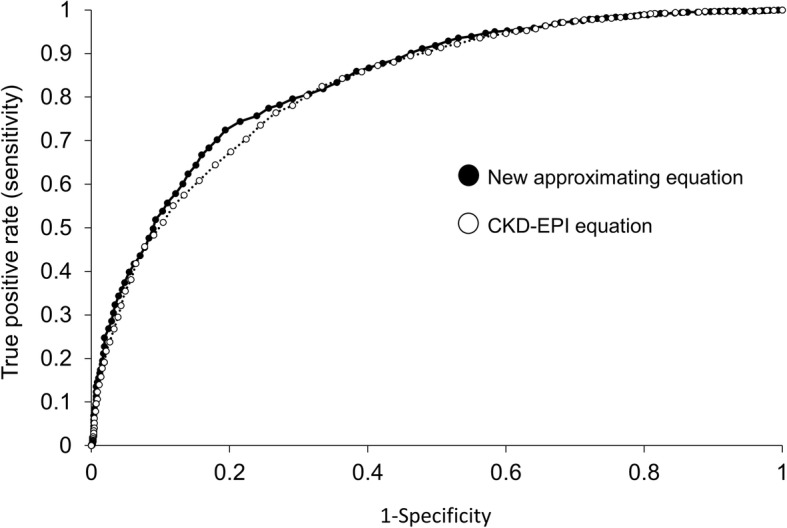
Receiver-operator curve (ROC) showing the false positive rate (1-specificity) on the x-axis and the sensitivity on the y-axis of the new approximating equations versus the CKD-EPI equation

Receiver-operator curve (ROC) showing the false positive rate (1-specificity) on the x-axis and the sensitivity on the y-axis of the new approximating equations versus the CKD-EPI equation