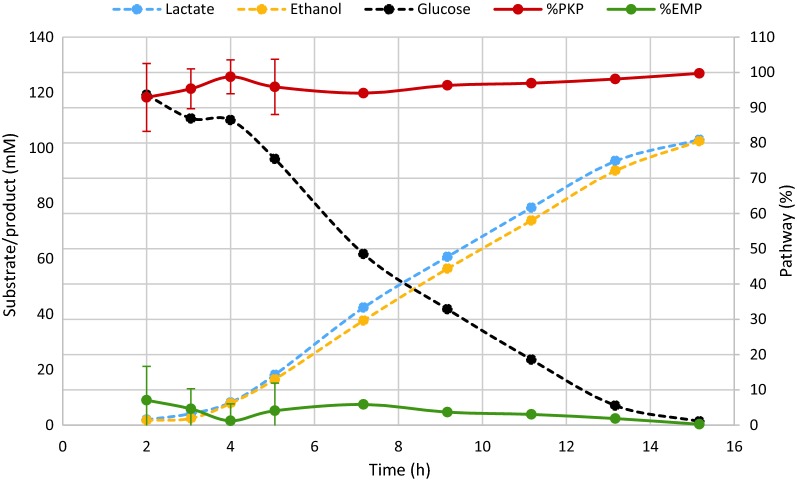
Fig. 2.
Typical fermentation profile and distribution between the EMP and PK pathways in L. reuteri JCM 1112 in chemically defined medium with glucose as the sole carbon source. Data are averages of the all the datasets used to constrain and validate the model, with error bars representing standard deviation. The percentage of PKP usage was defined as in Burgé et al. [4] i.e. as the ethanol concentration divided by the sum of lactate and ethanol concentrations divided by 2

