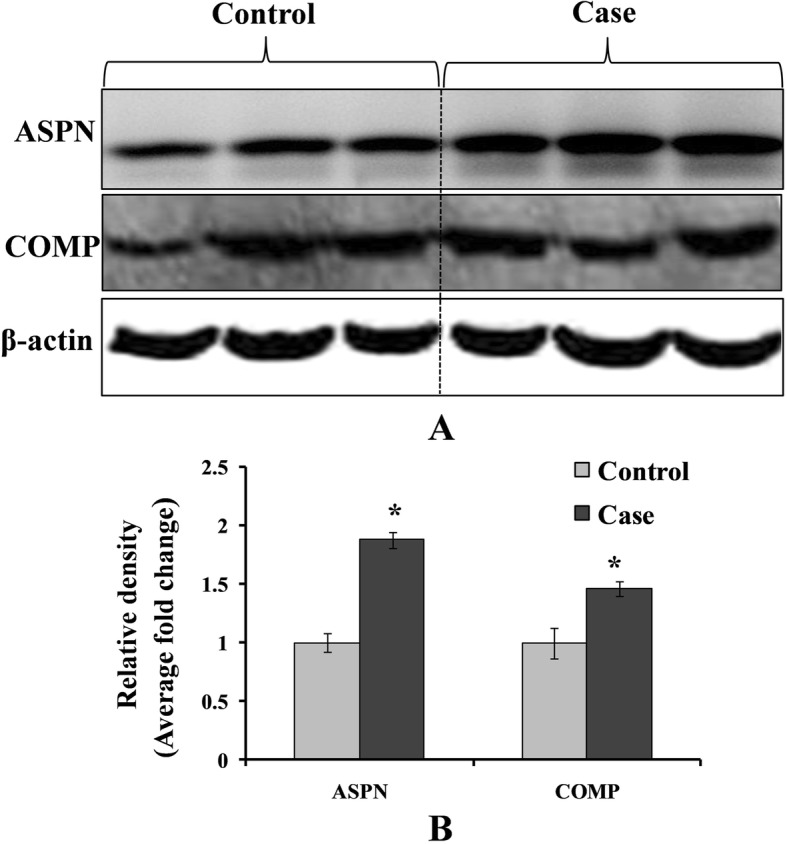
Fig. 2.

a Western blot analysis was performed to understand the protein level of ASPN and COMP in control and case study. b Bar diagram showing the relative protein density after normalization with β-actin. Relative protein density of ASPN and COMP was significantly increased in case study as compared to the control group. Representative blots showing three samples from each group (control and case). Values are expressed as mean ± SEM (n = 24). *p < 0.05 vs control
