
Table 2.
Expression level of AtNDA2, AtNDB4, and NADH:quinone oxidoreductase (CI) subunits in control cell lines (NDHF) before and after transduction with AtNDA2 and AtNDB4
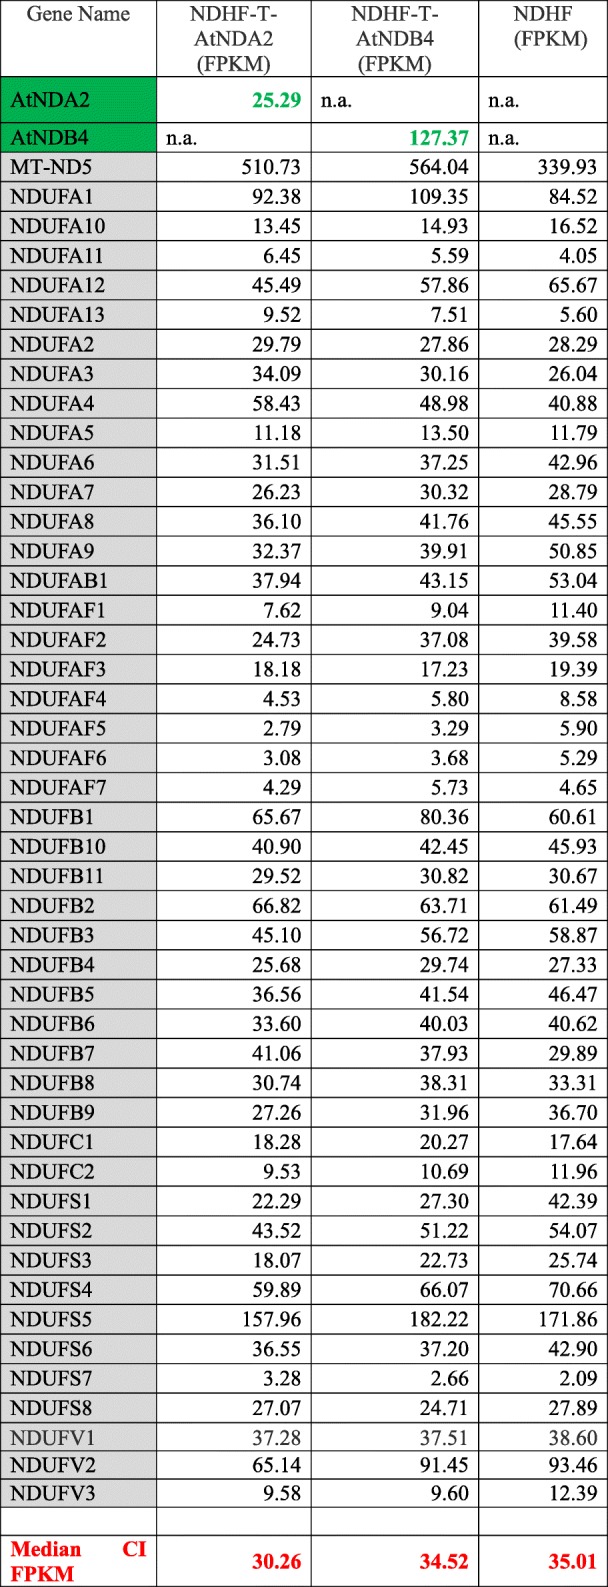
Expression levels are indicated in FPKM. In gray are labelled the NADH:quinone oxidoreductase subunits, in green the two NDH-2 genes. Median FPKM for CI subunits in both cell lines is given in red