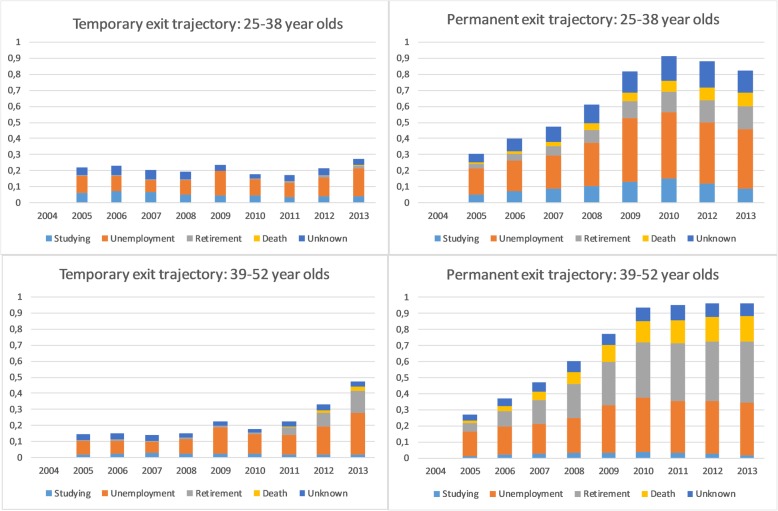
Fig. 5.
Reasons for exit (components of the exit trajectories) among younger (25–38 years) and older (39–52 years) age groups. Y-axis = probability of exit (0 = working, 1 = not working). In 2004 all were working by the cohort inclusion criteria. NB: In these age groups, retirement, i.e., the gray part of the column, is mostly disability retirement

