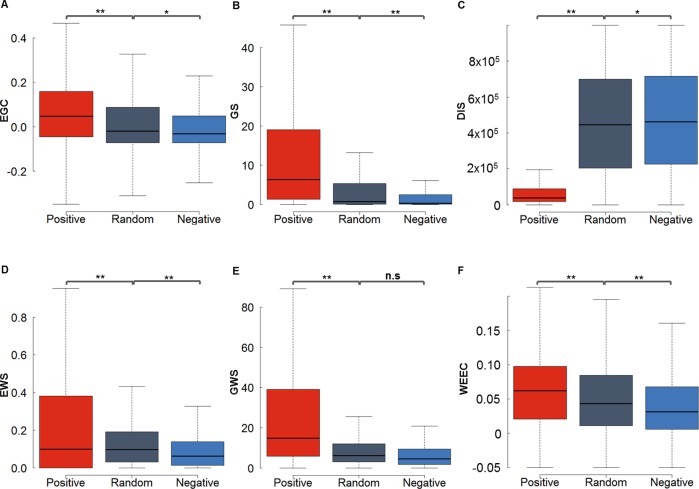
Fig 2. Six discriminative features based on the ChIA-PET data from K562.
(A) Enhancer activity and gene expression profile correlation (EGC). (B) Gene score (GS) from the RNA-seq data. (C) Distance (DIS) between enhancer and gene in a pair. (D) Enhancer window signal (EWS) measuring the mean enhancer signal in the region between enhancer and promoter (E) Gene window signal (GWS) evaluating the mean gene expression level in the region between enhancer and promoter (F) The weight of enhancer-enhancer correlation (WEEC). The positive, negative and random EG pairs were obtained from ChIA-PET dataset in K562. The P values were calculated using the Student t-test. *P < 0.01; **P < 1e-16; n.s. not significant.

