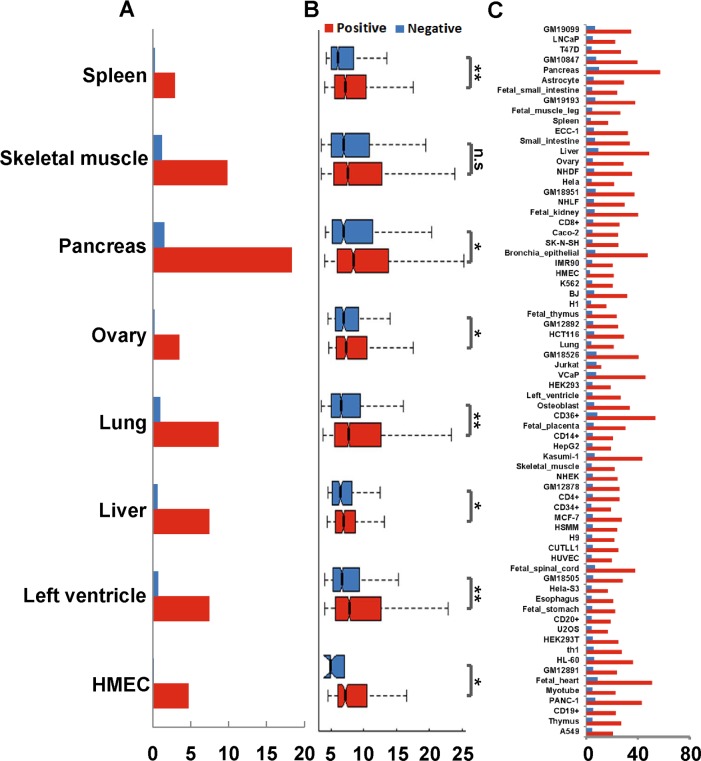
Fig 6. Predicted EG interactions are enriched for eQTLs.
(A) Percentages of tissue-specific eQTLs overlapping with interacting and non-interacting pairs, respectively. The eQTL datasets were from the corresponding tissue types that we used to predict enhancer-target gene pairs. (B) Significance (p-values) of eQTLs overlapping with interacting and non-interacting enhancer-target pairs. *P < 0.01; **P < 1e-16; n.s. not significant. (C) Percentages of interacting and non-interacting pairs overlapping with eQTLs combined from 48 tissues.

