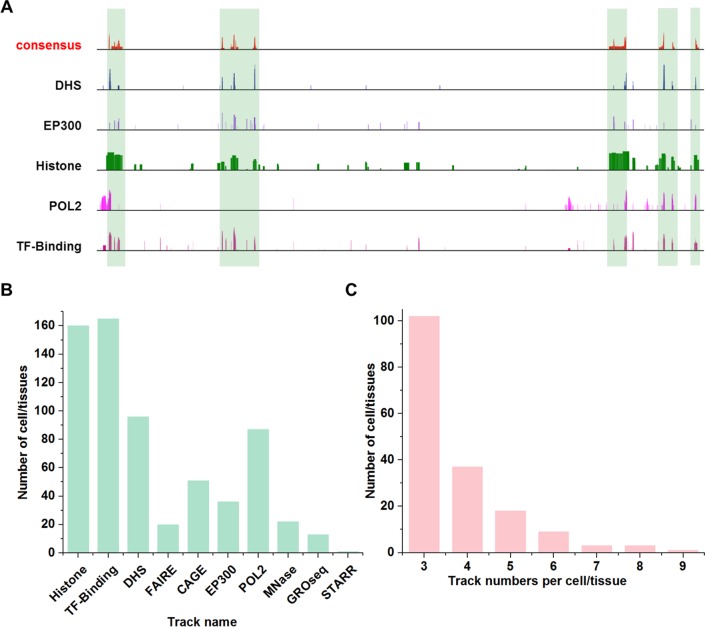
Fig 8. Enhancer consensus annotation in mouse cells.
(A) Consistency and discrepancies in enhancer annotation. Vertical bars mark the enhancers supported by many tracks. Note that many regions are only supported by one or a few tracks. (B) Number of tissue/cell types that contain certain dataset types. Some technologies were more widely used than others for enhancer identification. (C) The number of cell/tissue types in function of the number of independent tracks. Many cell/tissue types include a few tracks (e.g. 3 or 4), while a few cell/tissue types have many tracks (e.g. 8 or 9).

