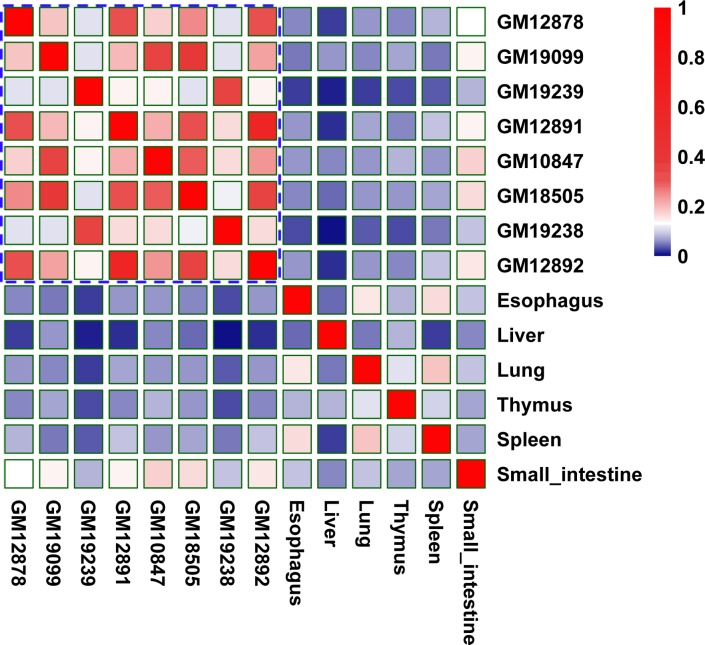
Fig 10. Patterns of predicted EG interactions across tissue/cell-types.
Similarities were measured by Jaccard index across different/similar tissue/cell types for EG interactions. For example, higher similarities are among blood cell lines, while other tissues displayed lower similarities with the other tissue/cell lines.

