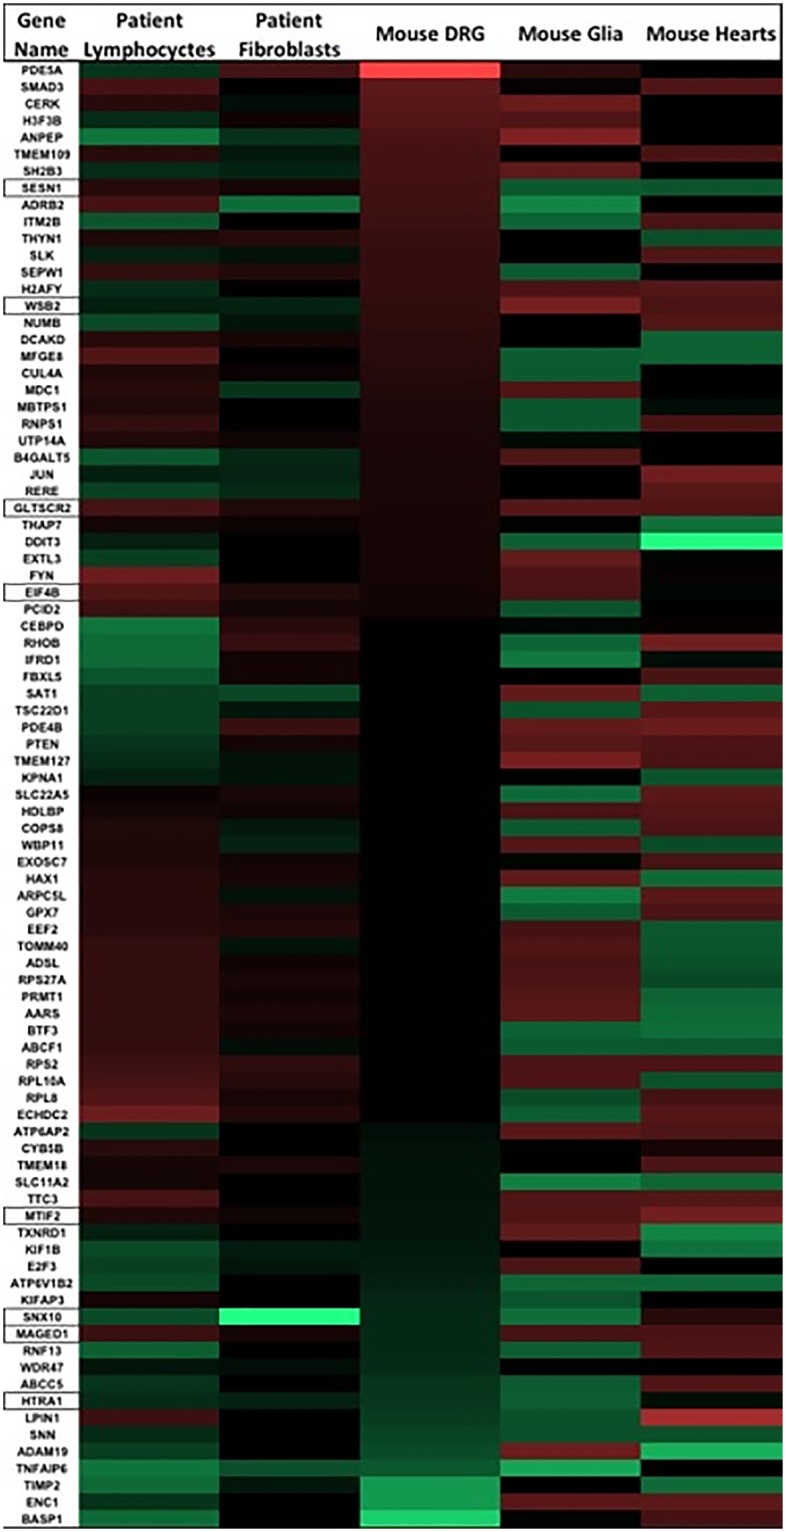
Fig 2. The 87 genes that were significantly changed in 4/5 experiments are shown as a heat map (Red = negative value, green = positive value, black = not significant).

Lymphocyctes, fibroblasts, glia, and heart samples are all expressed as FA/Control. Mouse DRGs are analyzed as a FXN correlation, (-1)x logFC of gene/FXN expression. Outlined genes in the gene column were significant in all 5 datasets.
