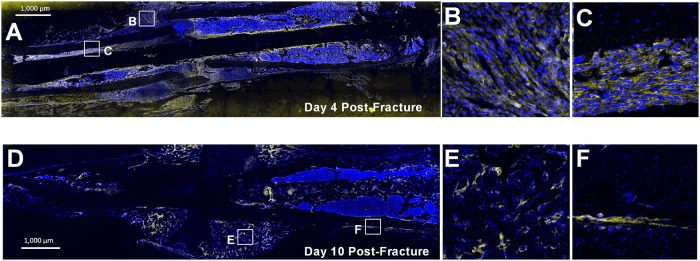
Fig 1. PDGFRβ is highly expressed in the periosteum post-fracture.
(A) 10x stitched tile scan image and (B,C) 100x magnification of selected locations (boxes) showing expansive PDGFRβ expression in the periosteum day four post-fracture. (D) 10x stitched tile scan image and (E,F) 100x magnification of non-cartilaginous areas of the fracture callus day ten post-fracture. B,E are located close to the fracture site, while C, F are distal to the fracture site showing activated periosteum. Blue = DAPI. Yellow = PDGFRβ immunostaining. Scale bar indicates 1,000μm.

