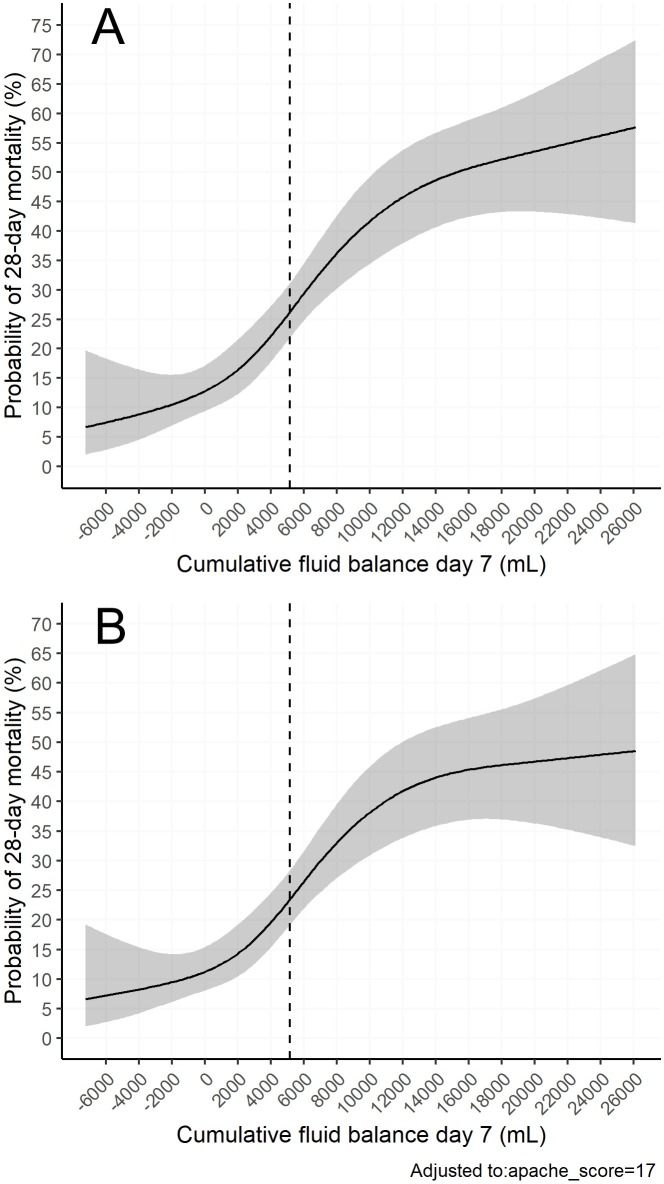
Fig 3. The relationship between probability of death and cumulative fluid balance.
Restricted cubic splines models. Confidence intervals (95%) are displayed in grey. The average cumulative fluid balance (5139 mL) is marked with the dashed line. A) Unadjusted probability of 28-day mortality on the y-axis. On the x-axis cumulative fluid balance on day 7 in mL. B) Probability of 28-day mortality on the y-axis, adjusted for severity of illness by APACHE II score. On the x-axis cumulative fluid balance on day 7 in mL.

