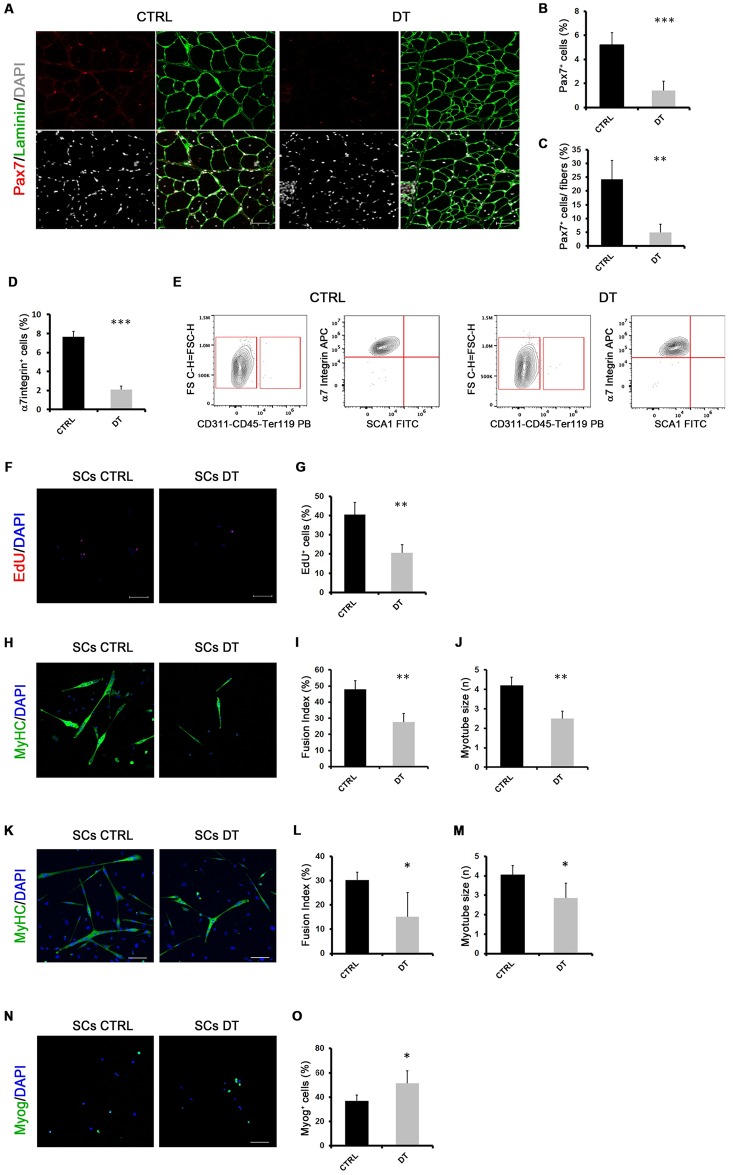
Fig 1. MΦ depletion compromises satellite cell potential in dystrophic mice.
(A, B, C) Representative images of double staining anti-laminin (green) and anti-Pax7 (red) of TA cryosections of mdxITGAM-DTR mice injected with PBS (CTRL) or DT. Nuclei were counterstained with DAPI (white). In the graphs are reported the percentage of Pax7+ cells relative to total cells or the percentage of Pax7+ cells relative to fibers; values are mean ± SEM; n = 3 animals for each experimental group; unpaired t test was used for comparison (**, P<0.01; ***, P<0.001). Scale bar = 50 μm. (D) Relative percentage of SCs sorted from muscles of mdxITGAM-DTR mice injected with PBS or DT. Cells isolated from hind limb muscles were first separated into hematopoietic lineage positive (Lin+) and hematopoietic lineage negative (Lin-) (Lin: CD45, CD31 and Ter119) cells. SCs were then sorted as α7Integrin+ (α7+)/Sca1-/ Lin-; the percentage of cells is reported as relative to whole mononucleated cells; values are mean ± SEM (n = 3 biological replicates for each experimental group; each replicate was the pool of 2 mice); unpaired t test was used for comparison (***, P<0.001). (E) Purity check of SCs sorted from muscles of mdxITGAM-DTR mice injected with PBS (CTRL) or DT. Freshly sorted SCs were analyzed by flow cytometry (CytoFLEX, Beckman Coulter) and showed purity ≥98%. (F, G) Sorted SCs were cultured in growth medium (GM) for 2 days and then EdU were added for 4 h in fresh GM before the fixation. EdU-incorporating SCs were then stained using Click-iT EdU Alexa Fluor Imaging Kit and 4′,6-diamidino-2 phenylindole (DAPI). Proliferating cells were counted checking the co-localization of DAPI and EdU positivity. In the graph is reported the quantification: values are mean ± SEM (n = 3 biological replicates for each experimental group; each replicate was the pool of 2 mice); unpaired t test was used for comparison (**, P<0.01). (H, I, J) Representative images of MyHC staining of SCs isolated from mdxITGAM-DTR mice injected with PBS (SCs CTRL) or DT (SCs DT) and differentiated ex vivo. The cells were cultured in growth medium for 48 hours and then shifted in differentiation medium for further 48h. Nuclei were counterstained with DAPI (blue). In the graphs are reported the quantification of two skeletal muscle differentiation parameters: fusion index (percentage of nuclei within myotubes: myotube = nuclei ≥2) and myotube size (mean of number of nuclei into myotubes). Data are represented as mean ± SEM (n = 4 independent experiments); unpaired t test was used for comparison (**, P<0.01). Scale bar = 100 μm. (K, L, M) Representative images of MyHC staining of SCs isolated from mdxITGAM-DTR mice injected with PBS (SCs CTRL) or DT (SCs DT) and high-density differentiated ex-vivo. The cells were cultured in growth medium for 48 hours and then seeded at high density (60000 cells/cm2) and, after few hours, once adherent, shifted in differentiation medium for a further 48h. Nuclei were counterstained with DAPI (blue). In the graphs are reported the quantification of fusion index (percentage of nuclei within myotubes: myotube = nuclei ≥2) and myotube size (mean of number of nuclei into myotubes). Data are represented as mean ± SEM (n = 4 independent experiments); unpaired t test was used for comparison (*, P<0.05). Scale bar = 100 μm. (N, O) Representative images of Myogenin (Myog) staining of SCs isolated from mdxITGAM-DTR mice injected with PBS (SCs CTRL) or DT (SCs DT) and seeded ex vivo in growth medium for 4 days. Nuclei were counterstained with DAPI (blue). In the graph is reported the quantification of Myog+ cells. Data are represented as mean ± SEM (n = 4 independent experiments); unpaired t test was used for comparison (*, P<0.05). Scale bar = 100 μm.

