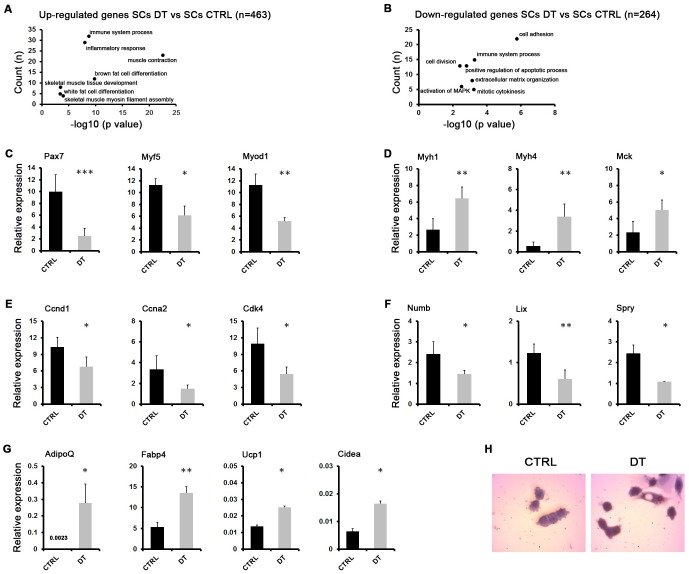
Fig 2. Transcriptome analysis reveals adipogenic conversion of SCs upon MΦ depletion in dystrophic muscles.
(A, B) Total RNA from SCs derived from PBS-injected (SCs CTRL) or DT- injected (SCs DT) mdxITGAM-DTR mice was used for RNA-Seq (n = 2 biological replicates for each experimental group; each replicate is the pool of 2 mice). Selected representative GO biological processes in upregulated (A) and downregulated genes (B) in SCs derived from DT-injected mdxITGAM-DTR mice compared to CTRL mice, identified by DAVID 6.8 are shown. The graph displays for each GO term the obtained p value (expressed as −log10) on the x axis and the number of genes included (count), on the y axis. (C, D, E, F, G) Expression analysis by qRT-PCR of myogenic (C, D), proliferation (E), self-renewal (F) and adipogenic (G) markers in SCs isolated from mdxITGAM-DTR mice injected with PBS (CTRL) or DT. The data are reported as relative to housekeeping gene TBP, and represented as mean ±SEM (n = 3 or 4 biological replicates for each experimental group; each replicate was the pool of 2 mice); unpaired t test was used for comparison (*, P<0.05; **, P<0.01; ***, P<0.001). (H) Representative images of in vitro cultures of SCs CTRL and SCs DT cells isolated from mdxITGAM-DTR mice injected with PBS (CTRL) or DT. The cells were cultured in SCs growth medium for 24 hours and then stained by Oil Red O dye and counterstained with Hematoxilin.

