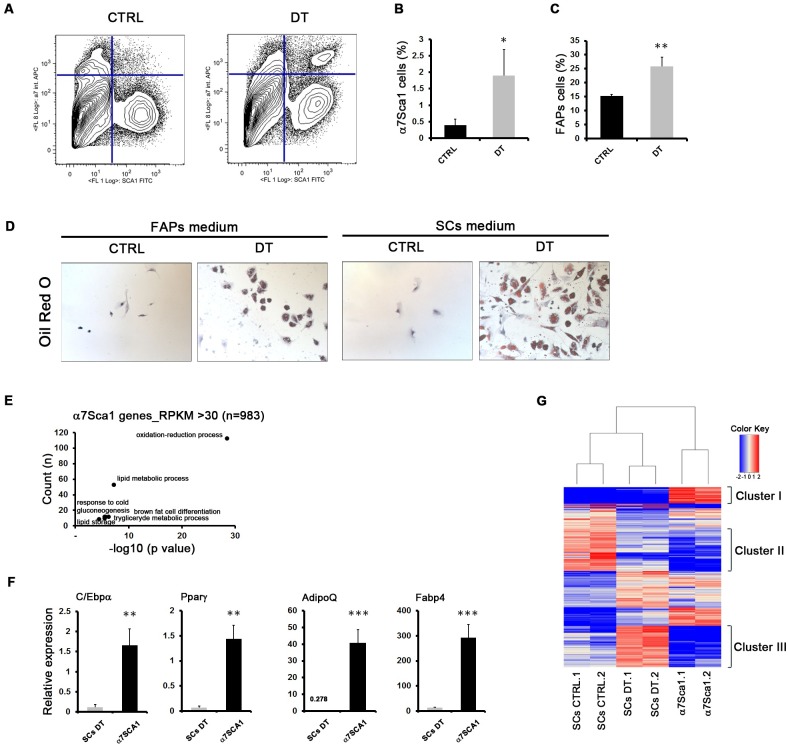
Fig 3. A novel cell population revealed in dystrophic muscles upon MΦ depletion.
(A) FACS plot representation of cell sorted from muscles of mdxITGAM-DTR mice. Cells were first separated into hematopoietic lineage positive (Lin+) and negative (Lin-) (Lin: CD45, CD31 and Ter119) cells. SCs and FAPs were sorted as described in S1C Fig. A double positive cell population α7+/ Sca1+/Lin- (α7Sca1 cells), was sorted from DT-injected mdxITGAM-DTR mice and was not significantly detectable in PBS-injected mdxITGAM-DTR mice. (B-C) Graphs showing the percentage of α7Sca1 cells (B) and FAPs (C) sorted from mdxITGAM-DTR mice injected with PBS (CTRL) or DT. The percentages are reported as relative to whole mononucleated cells. Values are mean ± SEM (n = 3 or 4 biological replicates for each experimental group; each replicate was the pool of 2 mice); unpaired t test was used for comparison (*, P<0.05; **, P<0.01). (D) Representative images of in vitro culture of α7Sca1 cells isolated from mdxITGAM-DTR mice injected with PBS (CTRL) or DT. The cells were cultured both in FAPs growth medium and in SCs growth medium for 36 hours and then cells were stained by Oil Red O dye and counterstained with Hematoxilin. Scale bar = 50 μm (E) Total RNA from α7Sca1 cells derived from DT- injected mdxITGAM-DTR mice was used for RNA-Seq (n = 2 biological replicates for each experimental group; each replicate was the pool of 2 mice). Selected representative GO biological processes in highly expressed genes (RPKM≥30) of α7Sca1 cells identified by DAVID 6.8 are shown. The graph displays for each GO term the obtained p value (expressed as −log10) on the x axis and the number of genes included (count), on the y axis. (F) Expression analysis by qRT-PCR of adipogenic markers in SCs and α7Sca1 cells isolated from DT-injected mdxITGAM-DTR mice. The data are reported as relative to housekeeping gene TBP, and represented as mean ±SEM (n = 3 biological replicates for each experimental group; each replicate was the pool of 2 mice); unpaired t test was used for comparison (**, P<0.01; ***, P<0.001). (G) Heat map of 727 deregulated genes in SCs (DEGs DT vs CTRL) isolated from mdxITGAM-DTR mice identified by RNA-Seq, compared to the expression pattern of α7Sca1 cells. The heat map shows the differential expression of DEGs in SCs and α7Sca1 cells as relative to the mean expression value of all six samples.

