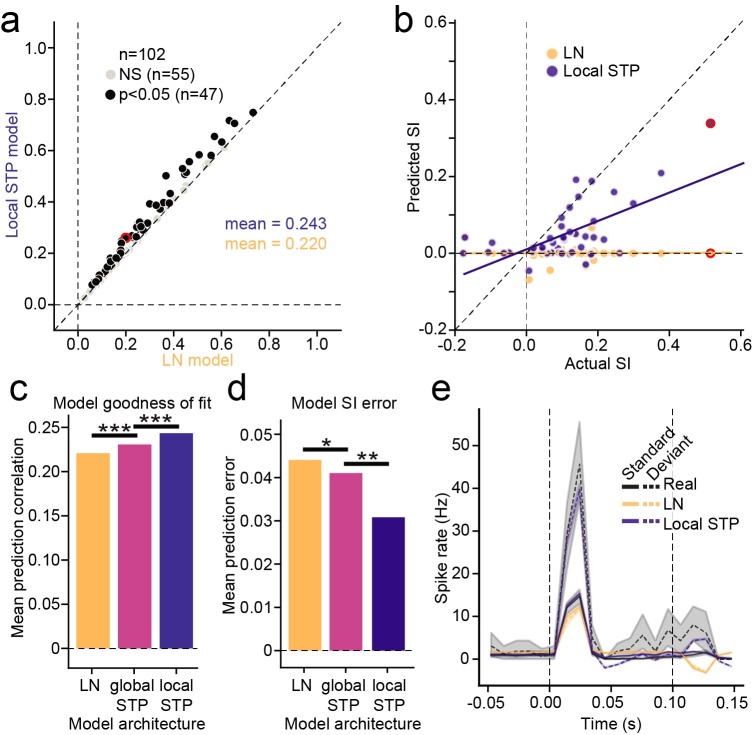
Fig 7.
A. Scatter plot compares prediction accuracy for the LN model and local STP model, estimated using oddball stimuli for each neuron. Black markers indicate significant difference in the performance between models (p<0.05, jackknifed t-test). B. Scatter plot compares SSA index (SI) calculated from actual responses against SI from responses predicted by LN model (orange) and local STP model (blue) for neurons with significant actual SI (p < 0.05, standard/oddball permutation test). The LN model is unable to account for any stimulus specific adaptation, while the SI predicted by the local STP model is correlated with the actual values (LN: r = 0.011, p = 0.95; local STP: r = 0.636, p = 3.4 x 10⁻⁶, Wald Test for non-zero slope). C. Summary of the mean prediction correlation for all cells across all tested models (LN model vs. global STP model, p = 1.7 x 10⁻⁴, global STP model vs. local STP model, p = 1.9 x 10⁻¹³, LN model vs local STP model, p = 1.1 x 10⁻¹⁵, sign test). D. Mean SI prediction error for each model architecture. The prediction error for each cell is the mean standard error (MSE) between actual and predicted SI (LN model vs. global STP model, p = 0.024; global STP model vs. local STP model, p = 0.005, LN model vs. local STP model, p = 1.5 x 10⁻⁴, sign test). E. Example actual (black), LN model-predicted (yellow) and local STP model-predicted (blue) PSTH response to standard (continuous line) and deviant (dashed line) noise bursts. Shaded areas standard error on the mean (bootstrap p = 0.05). Vertical lines mark sound onset and offset. For the LN model, both standard and oddball predictions are close to the actual standard response, but the local STP model predicts the enhanced oddball response. Example cell is highlighted in red in panels A and B. *p <0 .05, **p < 0.01, ***p < 0.001.

