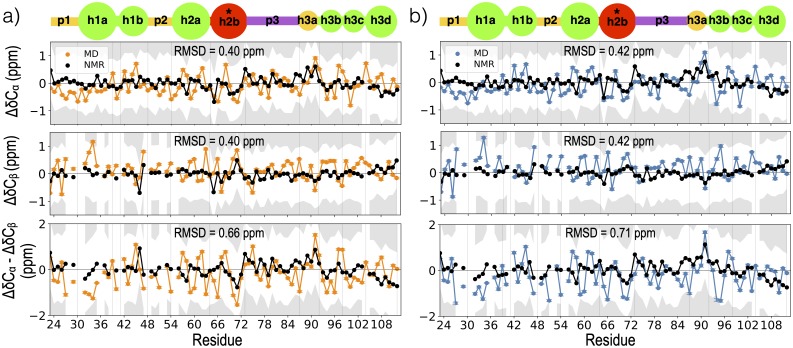
Fig 2. Comparison of MD and NMR observables.
a) ΔδCα (top), ΔδCβ (middle), ΔδCα-ΔδCβ (bottom) values from NMR at 280K (black lines) [63] and MD at 300K for the V66 (a) and M66 (b) sequences. The gray region represents a discrepancy of more than 1 ppm from NMR secondary chemical shifts. Root-mean-squared deviation (RMSD) represents the deviation between the NMR and MD values. Error at each residue is calculated as the standard error in the mean, where n = 1088 is the product of the total number of replicas simulated and the average number of roundtrips per replica. Panels are annotated by a blob representation of the prodomain, as in Fig 1e(i); vertical grey lines in each panel represent the blob boundaries.

