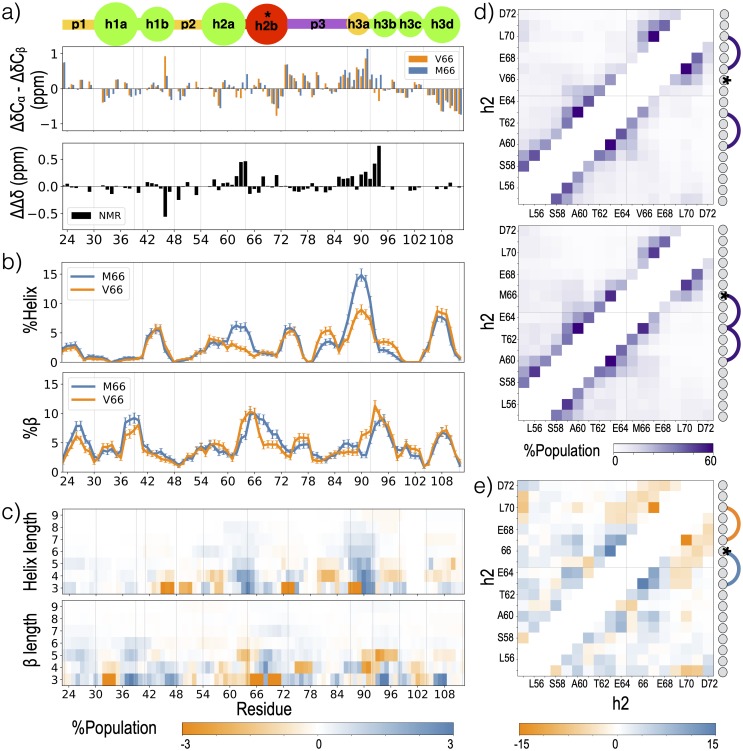
Fig 3. Effects of Val66Met on secondary structure.
a) ΔδCα-ΔδCβ values for the V66 and M66 sequences from NMR [63]. Values on top are equivalent to the two NMR curves shown in Fig 2 (bottom panel), while the difference between the two curves is shown at the bottom. b) Helix (top) or β (bottom) propensity for each simulated residue of the 300K replica, defined as the probability of a given residue being part of a sequence of four or more consecutive residues whose dihedral angles place them in the helical (left) region or β (right) region of the Ramachandran map (further described in Methods). Errors represent standard error of a Bernoulli trial with n samples, where n = 1088 is the product of the total number replicas and the average number of roundtrips per replica. c) Difference (M66-V66) between probabilities of secondary structure formation of a given length, for helix (top) and β (bottom). Panels are annotated by a blob representation of the prodomain, as in Fig 1e(i); vertical grey lines in each panel represent the blob boundaries. d) Contact probability for each residue pair within the h2 group for V66 (top) and M66 (bottom) sequences. Each residue in group h2 is annotated with a circle representation and contacts found in at least 50% of the frames are represented with an edge. e) Difference (M66-V66) between the contact probabilities shown in panel d. Contacts with a population difference of at least 15% between the V66 and M66 sequences are represented by an edge.

