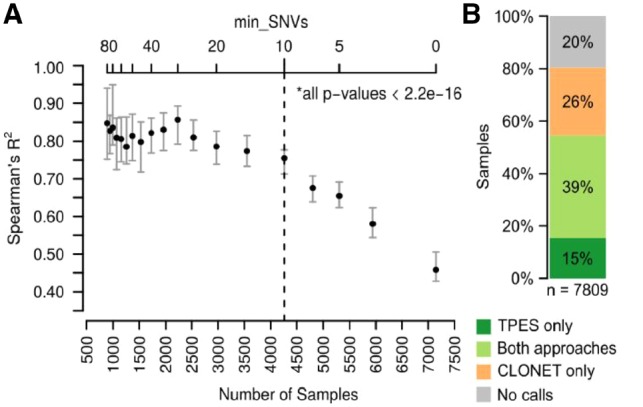
Fig. 1.

Performance on 7809 TCGA WES samples across 30 tumor types. (A) Correlation between TPES and CLONET estimates as a function of the minimum number of p-SNVs (top x-axis) used by TPES. The bottom x-axis indicates the number of samples for which TP is estimated by TPES, while varying the minimum number of top x-axis); 400 samples are randomly selected and Spearman’s correlation against CLONET estimates is computed; the procedure is repeated 60 times. For each value of min_SNVs, error bars represent the 1st to the 3rd quartile of the computed R2, while the dot represents the median value. All P-values are significant (alpha = 0.01). (B) TP call rates of study dataset samples compared to CLONET calls. Applied filters for purity assessment are >9 p-SNVs for TPES and >2 putative mono-allelic deletion segments for CLONET
