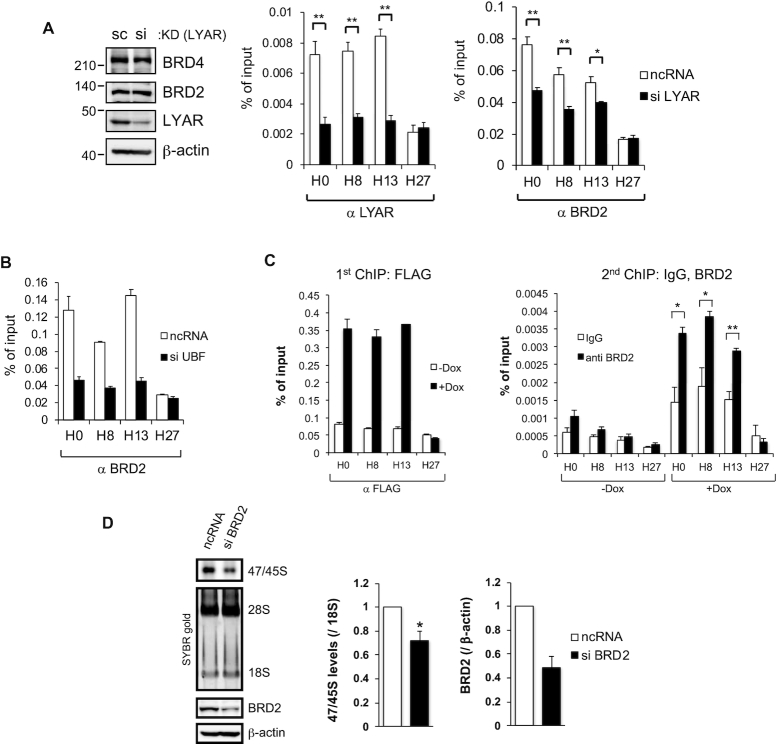
Figure 4.
LYAR recruits BRD2 to rDNA transcription sites (A) ChIP analysis of BRD2 binding to rDNA loci in 293T cells upon LYAR knockdown (KD). 293T cells were treated with an siRNA specific for LYAR (or ncRNA, control) and then subjected to ChIP analysis with an antibody against LYAR or BRD2. LYAR KD was confirmed by immunoblotting with antibodies indicated to the right of the panels. β-actin was used as the loading control. Molecular mass markers (kDa) are indicated to the left of the panels. The graphs show the amount of ChIPed DNA (% of input) relative to the number of rDNA loci with the antibody indicated under each graph. Data represent the mean ± SEM of three independent experiments. *P < 0.05, **P < 0.01 (unpaired t-test). (B) ChIP analysis of BRD2 binding to rDNA loci in 293T cells upon UBF knockdown. The cells were treated with an siRNA specific for UBF (or ncRNA) and then subjected to ChIP analysis with an antibody against BRD2. The graph shows the amount of ChIPed DNA (% of input). (C) Re-ChIP analysis showing that LYAR-BRD2-associated complexes bind rDNA loci. The first ChIP of HBF-LYAR, with anti-FLAG, was performed using HBF-LYAR-TO cells with or without Dox treatment (1st ChIP; left graph). The second ChIP, with anti-BRD2, was performed using the first ChIPed HBF-LYAR-associated complexes (2nd ChIP; right graph). As an antibody control for anti-BRD2, a nonspecific rabbit IgG was used. The graphs show the amount of ChIPed DNA (% of input). Data represent the mean ± SEM of three independent experiments. *P < 0.05, **P < 0.01 (unpaired t-test). (D) Metabolic labeling (4-thiouridine) of newly synthesized 47/45S pre-rRNA in 293T cells upon BRD2 knockdown (siRNA). The pre-rRNA was biotinylated and then subjected to agarose gel electrophoresis under denaturing condition and northern blotting. The signals for 47/45S pre-rRNA were detected by chemiluminescence. 28S and 18S rRNAs were used as loading controls (stained with SYBR gold). The graph shows the relative band intensities of biotin-labeled 47/45S pre-rRNA normalized to that of 18S rRNA. Data represent the mean ± SEM of four independent experiments. *P < 0.05, **P < 0.01 (paired t-test). Knockdown of BRD2 was confirmed by immunoblotting with anti-BRD2. β-actin was used as the loading control.

