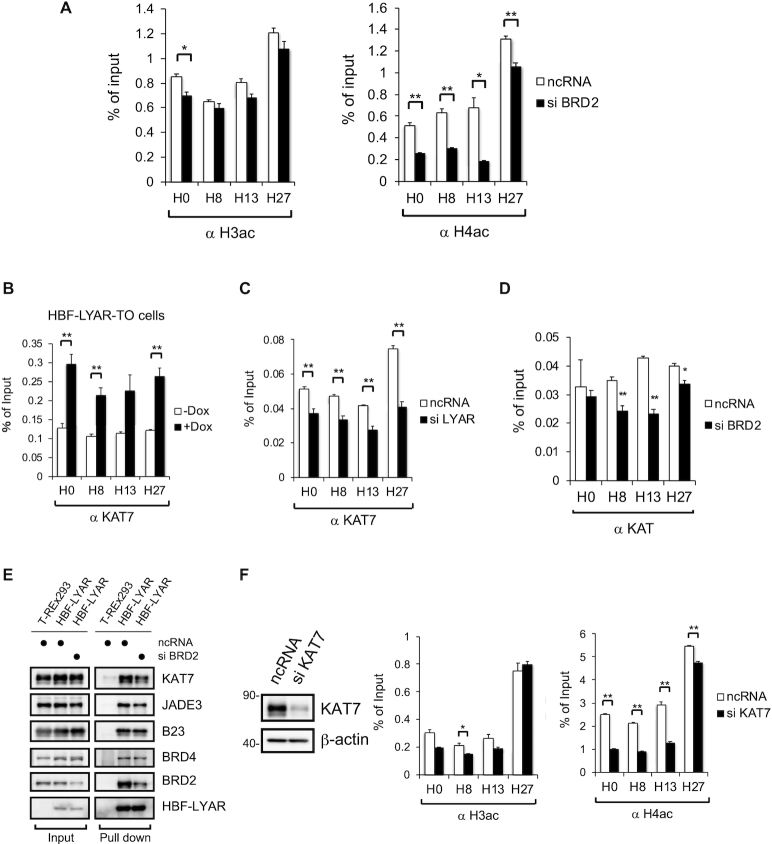
Figure 5.
BRD2 recruits KAT7 to rDNA loci (A) ChIP analysis of the extent to which H3 or H4 is acetylated. 293T cells were treated with an siRNA specific for BRD2 or ncRNA (control) and then subjected to ChIP analysis with an antibody against H3ac or H4ac, as indicated. The graphs show the amount of ChIPed DNA (% of input) relative to the number of rDNA loci indicated under each graph. Data represent the mean ± SEM of three independent experiments. *P < 0.05, **P < 0.01 (unpaired t-test). B–D) ChIP analysis of the binding of KAT7 to rDNA loci. HBF-LYAR-TO cells were treated with (+Dox) or without (–Dox) Dox (B). 293T cells were treated with ncRNA (control) or an siRNA specific for LYAR (C) or BRD2 (D) for 72 h. These cells were subjected to ChIP analysis with an antibody against KAT7. The graphs show the amount of ChIPed DNA (% of input) relative to the number of rDNA loci indicated under each graph. Data represent the mean ± SEM of three independent experiments. *P < 0.05, **P < 0.01 (unpaired t-test). (E) Immunoblotting for HBF-LYAR-associated proteins upon the knockdown of BRD2. HBF-LYAR-TO cells were treated with an siRNA specific for BRD2 for 72 h; after induction with Dox, the nuclear extract was subjected to the pulldown with two-step pull down with His6- and FLAG-tag of HBF-LYAR. HBF-LYAR-associated proteins were detected by immunoblotting with antibodies indicated to the right of the panels. (F) ChIP analysis of the extent to which H3 or H4 is acetylated. 293T cells were treated with an siRNA specific for KAT7. These cells were subjected to ChIP analysis with an antibody against H3ac or H4ac, as indicated. 293T cells were treated with ncRNA (control) or an siRNA specific for KAT7. The graphs show the amount of ChIPed DNA (% of input) relative to the number of rDNA loci indicated under each graph. Data represent the mean ± SEM of three independent experiments. *P < 0.05, **P < 0.01 (unpaired t-test).

