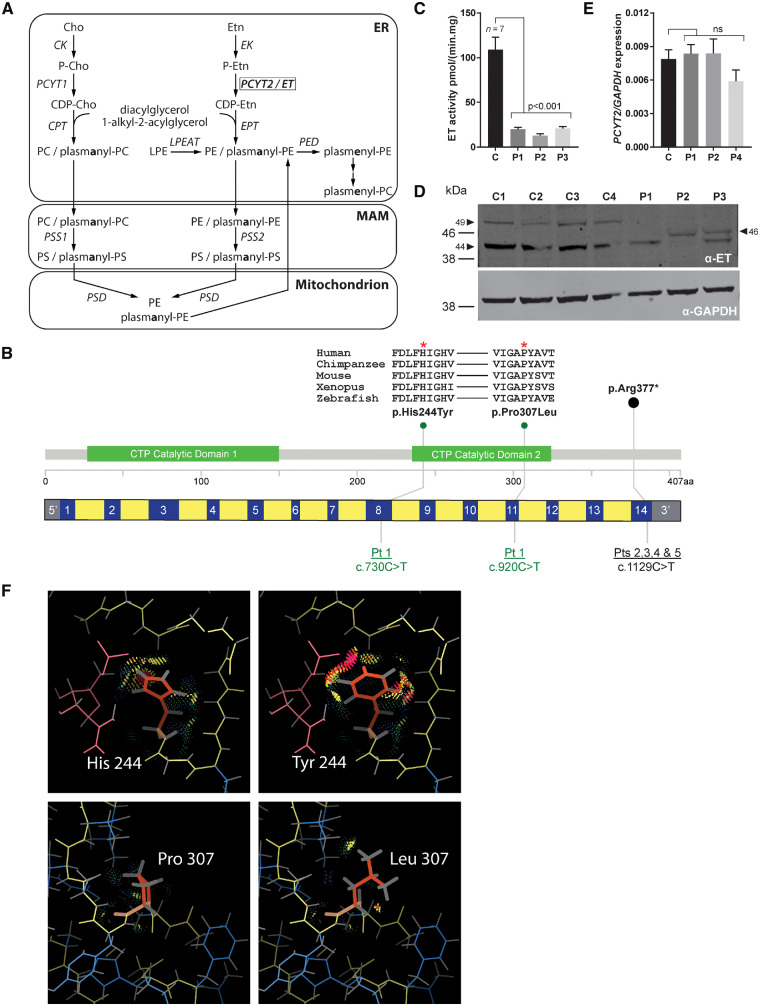
Figure 1.
PE-related phospholipid metabolism and functional characterization of PCYT2 deficiency. (A) Biosynthesis of phosphatidylethanolamine (PE), phosphatidylcholine (PC) and related etherphospholipids with subcellular distribution. After synthesis of phosphoethanolamine (P-Etn) by ethanolamine (Etn) kinase (EK), PCYT2/CTP:phosphoethanolamine cytidylyltransferase (ET) catalyses the conversion of CTP and P-Etn into the activated nucleotide intermediate CDP-ethanolamine (CDP-Etn). The P-Etn moiety of CDP-Etn is then transferred to the sn-3 hydroxyl of diacylglycerol by CDP-ethanolamine:1,2-diacylglycerol ethanolaminephosphotransferase (EPT) or CDP-choline:1,2-diacylglycerol choline/ethanolamine phosphotransferase (CPT) to form PE. Similarly, choline (Cho) kinase (CK) produces phosphocholine (P-Cho) that is converted to CDP-choline (CDP-Cho) by CTP:phosphocholine cytidylyltransferase (PCYT1) and condensed by CPT to form PC. PE and PC etherphospholipids are synthesized by EPT/CPT from peroxisome-derived 1-alkyl-2-acylglycerols that are condensed with CDP-Etn or CDP-choline (CDP-Cho) to form plasmanyl-PC/PE. In the mitochondria-associated membranes (MAM), base exchange of PC, PE and their corresponding plasmanyl-counterparts by PS synthase 1 and 2 (PSS1/2) yields PS and plasmanyl-PS, respectively. PS decarboxylase (PSD) that is located at the outer surface of the inner mitochondrial membrane can produce PE and plasmanyl-PE. Plasmanyl-PE is then desaturated to plasmenyl-PE (plasmalogen-PE) by plasmanylethanolamine desaturase (PED) in the endoplasmic reticulum (ER) after which plasmenyl-PC (plasmalogen-PC) is produced by base-exchange. Another source of PE is the reacylation of lyso-PE by lyso-PE acyltransferase (LPEAT). (B) Schematic diagram demonstrating the location of PCYT2 variants within the gene and protein. Exons are blue, introns yellow. Patients 2–5 share a homozygous nonsense variant in the final exon. Patient 1 is compound heterozygous for two missense variants both within the second cytidylyltransferase (CTP) catalytic domain. Evolutionary conservation alignments generated using the Clustal Omega tool shows the well conserved nature of both affected amino acid residues. (C) ET activity in fibroblasts (mean ± SD) of controls (C) (n = 7) and Patients (P) 1–3 showing a strong reduction of this activity in all three patients. (D) ET and GAPDH western blot of fibroblast homogenate of control, Patients 1–3 (C, P1, P2 and P3) showing absence of the 49 kDa band in patients as well as reduced intensity of the normally most abundant 42 kDa band. In Patients 2 and 3, an additional band was observed at 46 kDa. (E) PCYT2 mRNA expression relative to GAPDH (mean ± SD) for control and Patients 1, 2 and 4 (C, P1, P2, P4). PCYT2 mRNA levels are not affected by the variants the PCYT2 gene. (F) Top: Replacement of His244 with Tyr; bottom: replacement of Pro307 with Leu. Protein main chain is shown in yellow, and the mutated residue in orange, other side chains in blue and the ligand in pink. Interactions between the mutated side chain and its surrounding environment are shown with dots and spikes. Most interactions are favourable, with the exception of large van der Waals overlaps (pink); the latter are mostly between Tyr244 and the ligand.

