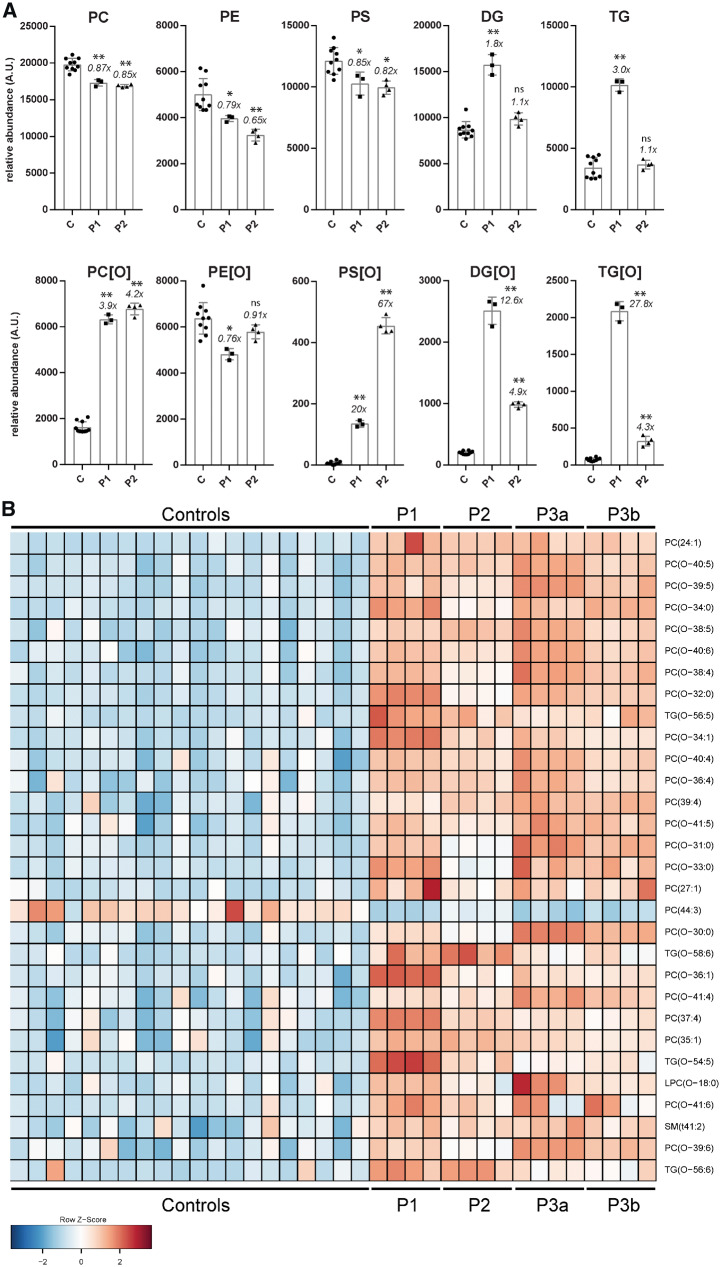
Figure 3.
Lipidomics in PCYT2 deficiency. (A) Summation of lipidomic species per major class for controls (three controls each measured as n = 3), Patients 1 (n = 3) and 2 (n = 4), mean ± SD is shown and x-fold difference of the patient mean compared to that of control subjects. *P < 0.01, **P ≪ 0.001. (B) Lipidomics in plasma: heat map of the top 30 lipids ranked according to VIP score (measure of a variable’s importance in the PLS-DA model). Plasma was available from Patients 1–3 (the latter from two separate blood collections, designated 3a and 3b). The lipidome of the three patients shows a clear accumulation of PC[O] and TG[O] species. ns = not significant; TG = triacylglycerol; TG[O] = 1-alkyl-2,3-diacylglycerols.

