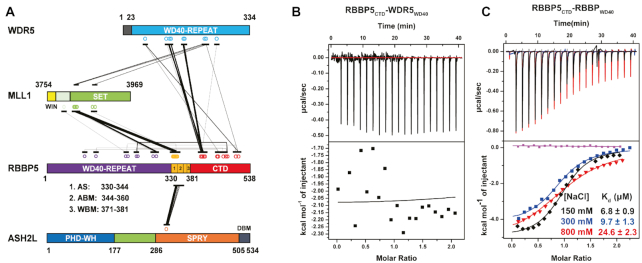
Figure 2.
The internal interactions in RBBP5. (A) Schematic representation of inter-protein crosslinks detected by CX-MS analysis of the MLL1 complex. RBBP5 intra-protein crosslinks are also labeled. The width of the linking line is correlated to the peptide amount of one specific crosslink appeared in the MS. (B) WDR523–334 has no interaction with RBBP5CTD (residues 381–538) as shown by a representative ITC binding curve. The assay buffer is 150 mM NaCl, 25 mM Tris–HCl, pH8.0. (C) RBBP5WD40 (residues 2–333) has a direct interaction with RBBP5CTD (residues 381–538) as shown by representative ITC binding curves at three different salt concentrations (150, 300 and 800 mM NaCl in the presence of 25 mM Tris–HCl, pH 8.0 buffer). The binding affinity slightly decreased with the increase of salt concentration. The purple curve is the buffer titrated with RBBP5CTD. The dissociation constants (Kd) and the reported fitting errors were determined from the representative ITC curves by data fitting using one-site binding model.

