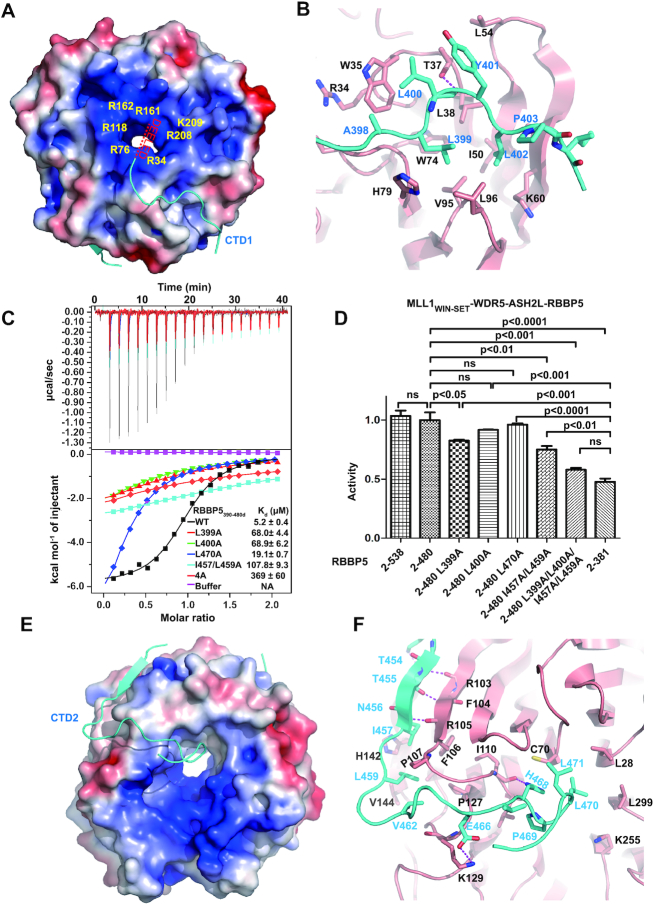
Figure 4.
The interaction interface between RBBP5WD40 and RBBP5CTDM. (A) The RBBP5CTD1-binding pocket on RBBP5WD40. RBBP5WD40 surface is colored according to its electrostatic potential (positive potential, blue; negative potential, red). RBBP5CTD1 is shown in cyan. One possible path of the absent N-terminal acidic extension of RBBP5CTD1 is indicated. (B) Details of hydrophobic interactions between RBBP5WD40 and RBBP5CTD1. The critical residues are presented as ball-and-stick models. RBBP5WD40 residues are colored in red and RBBP5CTD1 residues in cyan. Hydrogen bonding interactions are shown as dashed magenta lines. (C) Effects of mutations in the RBBP5CTDM on the interaction between RBBP52–333 and RBBP5CTDM (RBBP5390–480d) analyzed by ITC assays. ITC buffer is 25mM Tris–HCl, 300 mM NaCl, pH 8.0. The RBBP5–4A mutation is L399A/L400A/I457A/L459A mutation. The dissociation constants (Kd) and the reported fitting errors for each mutant were determined from one representative ITC curve by data fitting using one-site binding model. (D) HKMT activities of the MLL1 complexes (MLL13754–3969–WDR523–334–ASH2FL–RBBP5) containing different RBBP5 mutants determined by the MALDI-TOF-based methyltransferase assays. The HKMT activities are normalized to the activity of RBBP52–480-containing MLL1 complex. Mean ± s.d. (n = 3) are shown. The ANOVA test was used to determine the statistical difference of HKMT activities between groups. The label ‘ns’ stands for ‘not significant’ (P> 0.05). (E) The RBBP5CTD2-binding surface on RBBP5WD40. RBBP5WD40 surface is colored according to its electrostatic potential (positive potential, blue; negative potential, red). RBBP5CTD2 is shown in cyan. (F) Details of hydrophobic interactions between RBBP5WD40 and RBBP5CTD2. The critical hydrophobic residues are presented as ball-and-stick models. Salt bridge and hydrogen bonding interactions are shown as dashed magenta lines.

