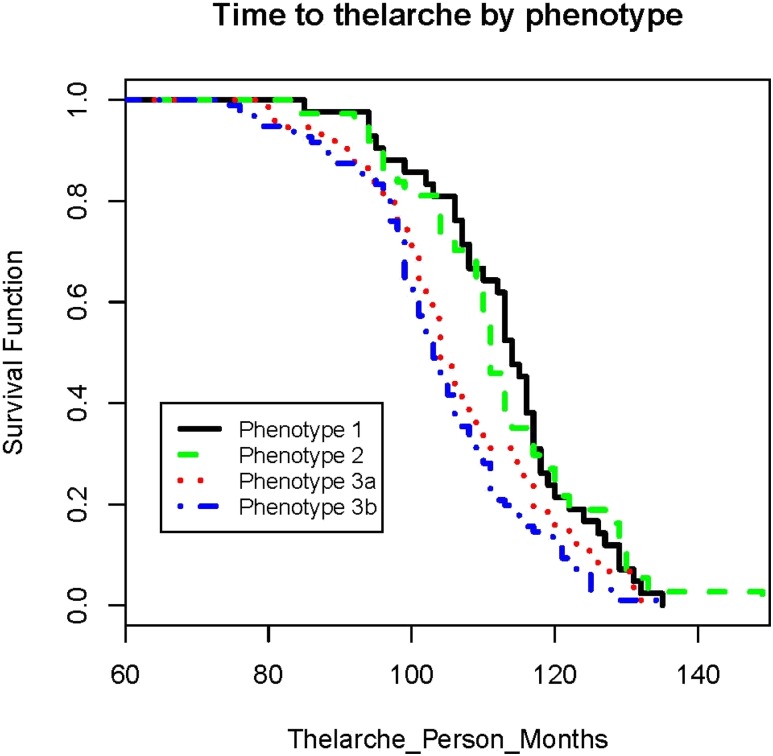
Figure 2.
The time to thelarche was longest for the girls in phenotypes 1 and 2, whereas it was the shortest for girls in phenotypes 3a and 3b. The time under observation began at birth for all girls. We have changed the x-axis of the figure to begin at 60 mo so that the individual curves are more visible.

