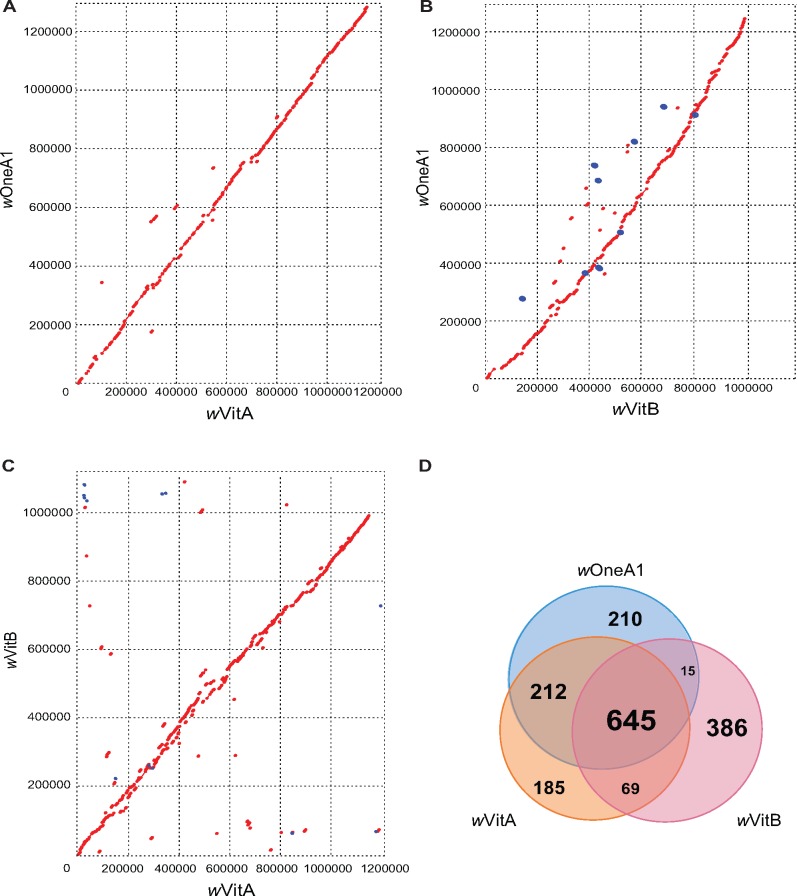
Fig. 1.
—Comparative genomic analysis of wOneA1, wVitA, and wVitB genomes. (A) Dot plot showing comparison between wOneA1 and wVitA genomes, red for a forward match and blue for a reverse match; (B) Dot plot showing comparison between wOneA1 and wVitB genomes; (C) Dot plot showing comparison between wVitA and wVitB genomes; (D) Venn Diagram showing comparison of genes and pseudogenes in wOneA1, wVitA and wVitB.

