Figure 3.
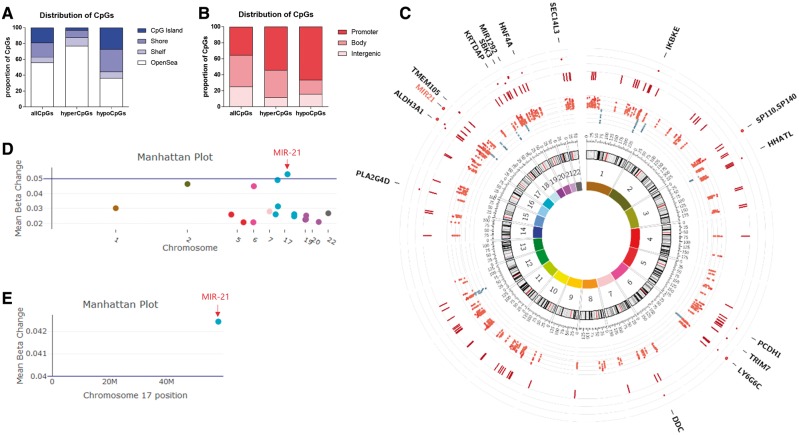
Epigenome-wide DNA methylation analysis reveals MIR-21 as the top hypermethylated region in CD4 T cells from FAE-treated patients. CD4 T cell DNA from 47 treatment-naïve, 35 FAE-treated and 16 GA-treated multiple sclerosis patients was analysed by using the Infinium MethylationEPIC BeadChip array. To identify differentially methylated regions between treated and untreated patients, we utilized a linear regression model at each individual CpG site to identify the contribution of treatment status in DNA methylation changes after controlling for age, gender, race, disease duration, the total CD4 T cell percentage as well as the percentage of CCR6−CCR4+, CCR6+CCR4+ and CCR6+CCR4− CD4 T cells in each sample. We then used a 1-kb sliding window to define genomic regions with closely located CpG sites, and then combined each CpG specific P-value from our previous linear regression model within a single region with the Stouffer’s method. This was followed by the Bonferroni correction for multiple hypothesis testing. DMRs were defined as regions with more than four CpG sites that have an absolute median β-value change > 0.02 and an adjusted combined P-value of < 0.01. Based on this analysis we uncovered 202 hypermethylated DMRs (containing 1545 CpGs) and only 13 hypomethylated DMRs (containing 158 CpGs) in FAE-treated patients compared to controls. (A and B) The CpGs distribution of these hypermethylated (hyperCpGs) and hypomethylated (hypoCpGs) DMRs was compared to that of the CpG distribution in the Illumina Infinium MethylationEPIC BeadChip (allCpGs). (C) Circos plot showing (from inside out); innermost first circle: chromosomal colors, numbers and size; second circle: a scatter plot with each point representing the genomic location and mean change in β-value of hypomethylated (in blue) and hypermethylated (in red) CpG sites; third circle: dark red perpendicular lines represent the genomic location of significantly hypermethylated DMRs; fourth circle: dark red scatter plot with each point representing the genomic location and mean beta change of significantly hypermethylated DMRs spanning more than 10 CpGs; outermost fifth circle: contains the names of genes whose promoters are located in these large DMRs (MIR-21 is shown in red). (D) Manhattan plot of the discovery cohort analysis showing mean beta change of significantly hypermethylated DMRs spanning more than 10 CpGs, where MIR-21 was the top differentially methylated locus. (E) Manhattan plot from the pair-wise longitudinal analysis showing that MIR-21 was the hypermethylated DMR with the most consistent and greatest methylation change in the validation cohort.

