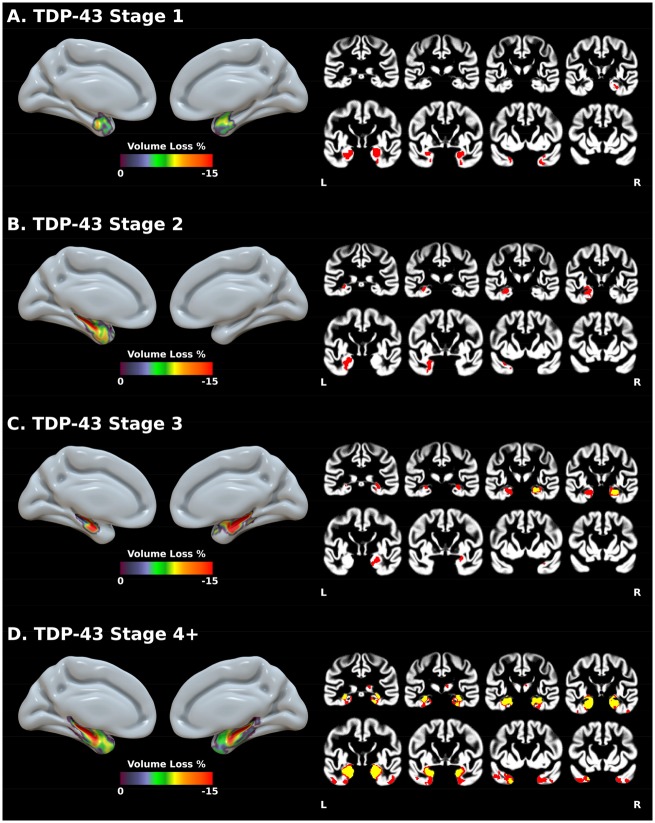
Figure 2.
Results of voxel-wise robust regressions showing the effect of TDP-43 stages on grey matter volume. Values represent the percentage of volume change associated with TDP-43 stages compared to the TDP-43-negative group. Coronal slices show both P < 0.001 FDR-corrected (yellow) and P < 0.001 uncorrected (red) results (k > 500 mm3). Results are presented in neurological convention. L = left; R = right.

