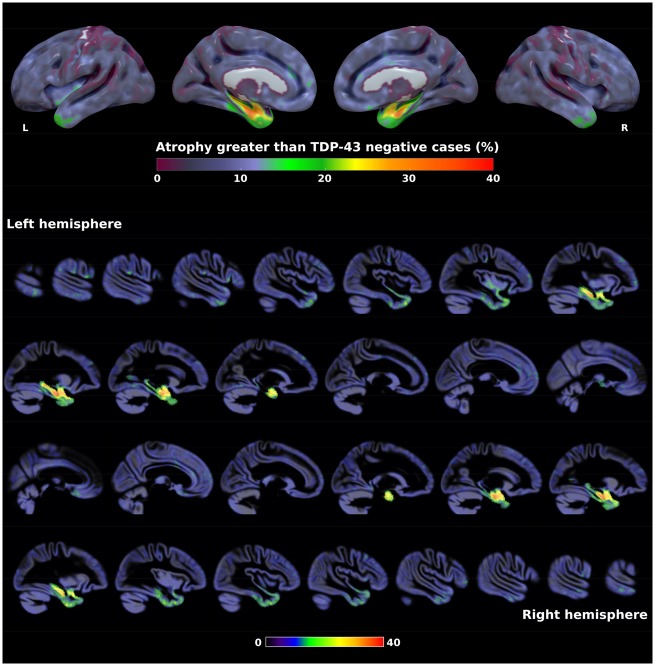
Figure 5.
Frequency map of grey matter atrophy in TDP-43-positive cases compared to TDP-43-negative cases. Values represent the percentage of TDP-43-positive cases having significantly more atrophy than the TDP-43-negative group (W-score < –1.65) accounting for Braak stage, Lewy body stage, diffuse and neuritic amyloid-β plaques, argyrophilic grain disease, vascular pathology, age at MRI, time MRI to death, sex, total intracranial volume, and MRI magnetic field. Results are presented in neurological convention. L = left; R = right.

