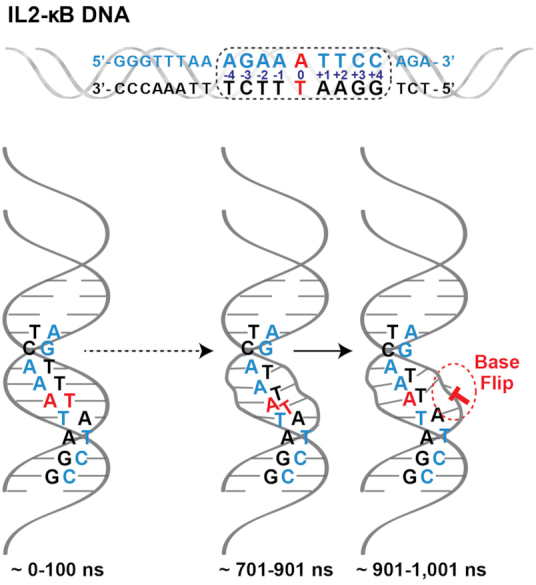
Figure 6.

Molecular dynamics (MD) of IL-2 κB DNA in its unbound state. Upper panel, the 20 bp DNA sequence from the promoter for IL-2 is depicted with its consensus κB DNA site enclosed in the dashed outline box. Bottom panel, a cartoon representation of changes that occur consistently during the time course of the MD simulation within the central A:T portion the IL-2 κB DNA that lead to flipping of the 0 position T base. Time ranges are denoted in nanoseconds (ns).
