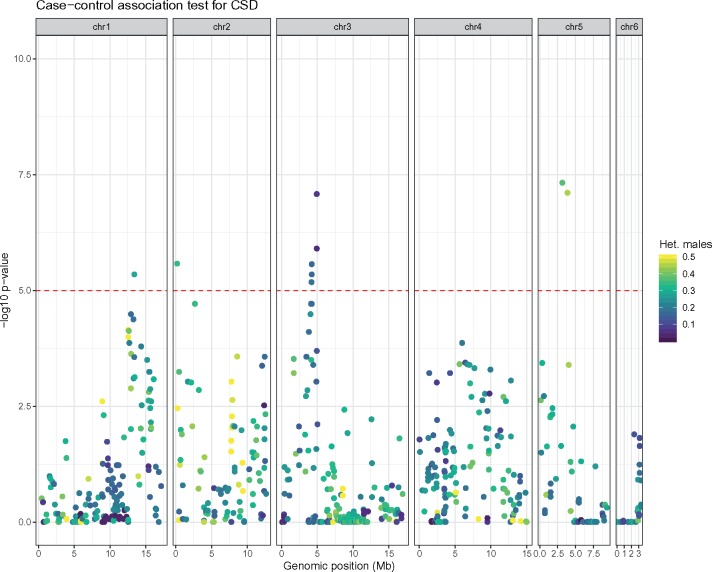
Fig. 2.
—Four CSD candidate regions in Lysiphlebus fabarum. Association mapping using one-sided Fisher’s exact tests for identifying SNPs with an excess of heterozygotes in females relative to males. The Manhattan plot shows −log10 P values, after Benjamini–Hochberg correction for multiple testing. The different panels show data for different chromosomes, with the horizontal red dashed line showing the P = 10e-5 threshold. SNPs are colored according to the proportion of heterozygous males.

