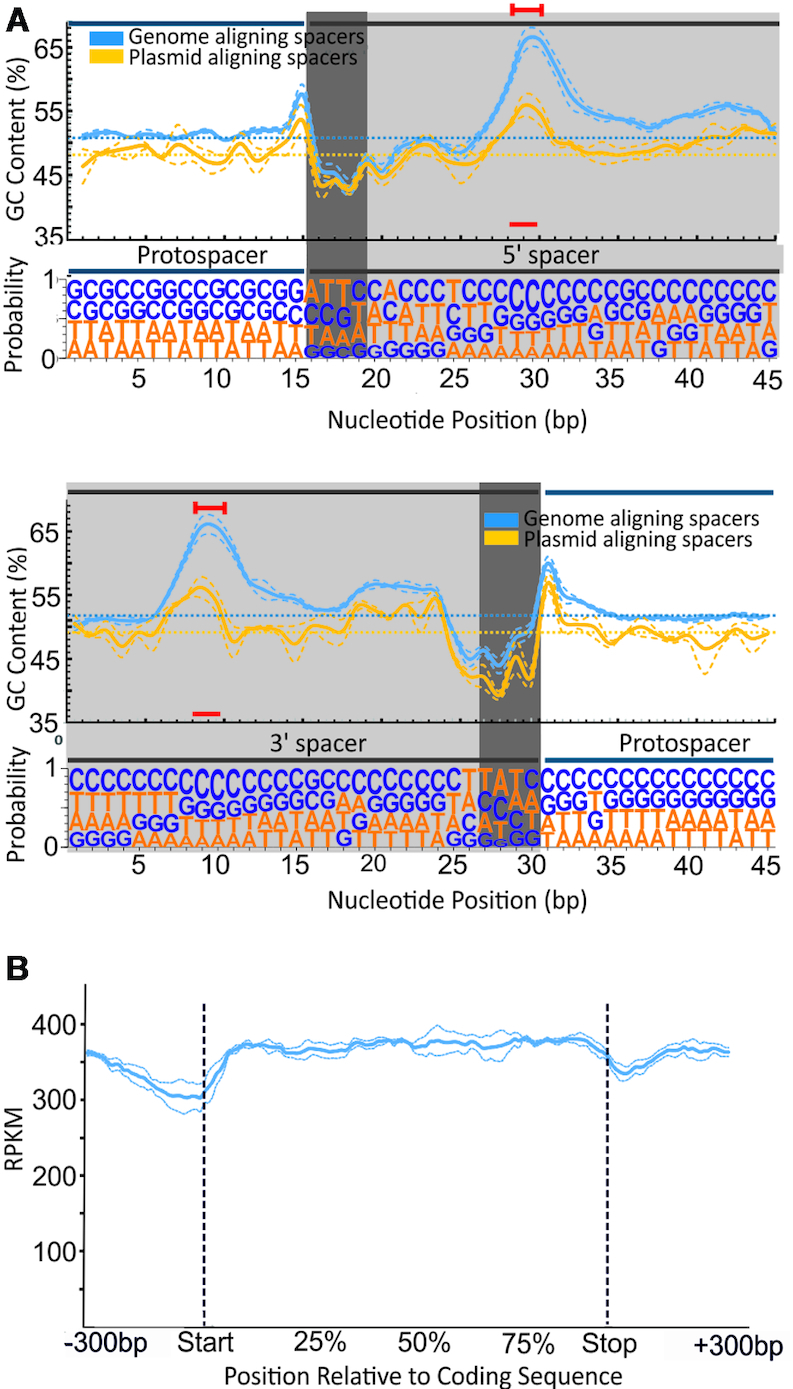
Figure 4.

Spacer composition and position relative to coding sequences. (A) GC content (above) and nucleotide probabilities (below) at each position along the wild-type RT-Cas1–acquired protospacers. Given the variation of protospacer length, two panels are shown, with the spacer anchored 5′and 3′ at positions 15 and 35, respectively. Spacer (gray background) and flanking (white background) nucleotides are shown. The dark gray background indicates asymmetry at the two ends of the spacers, with a stretch of positions rich in ‘AT’ (see text). The particular bias towards ‘C’ within the spacer observed is indicated by a red line. The ‘GC’ content is shown for spacers aligning with the genome (blue) and plasmid (yellow). (B) Gene body coverage of spacer alignments along the length of transcripts. The relative position corresponds to the percentile of coding sequence length ± 300 bp of the adjacent genomic regions. Dotted lines in A and B represent the mean error of alignment for the three assays in which the largest numbers of spacers were detected (>10,000 newly acquired spacers per experiment).
