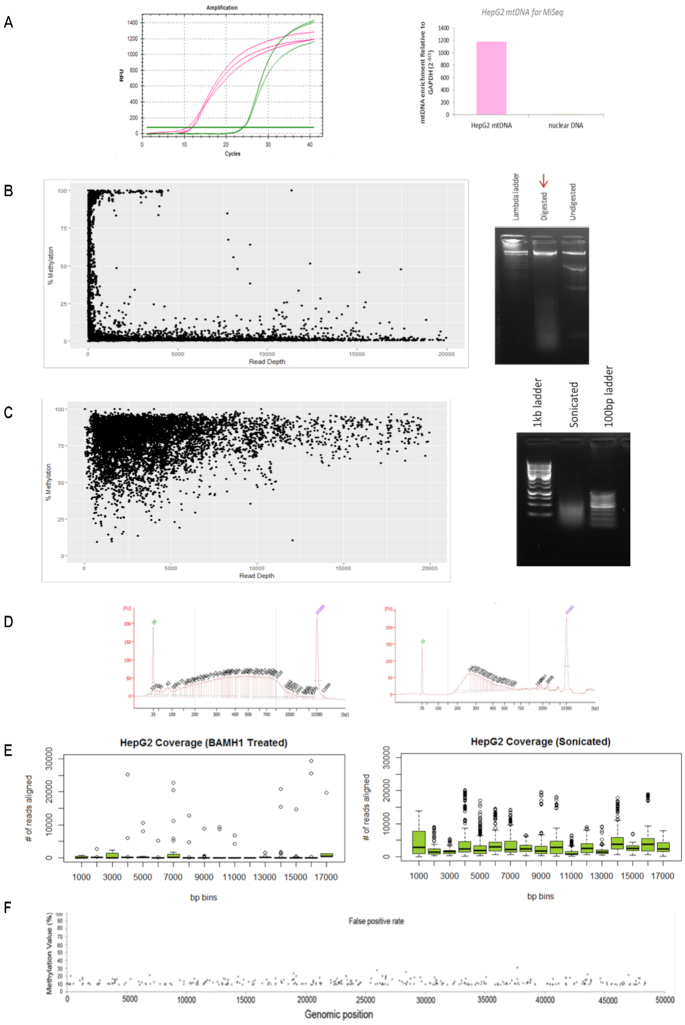
Figure 1.
Mitochondrial DNA sequencing requires method adjustments. (A) Raw amplification cycles of mtDNA enrichment assessed with qPCR of a mitochondrial specific genomic region compared to nuclear specific GAPDH genomic region (left panel). Relative fold enrichment of mtDNA to nuclear DNA (2−ΔCt) for HepG2 mtDNA extractions is indicated (right panel). The lack of nuclear DNA enrichment confirms the quality of mtDNA extraction. (B) Cytosine methylation compared to sequencing read depth (left panel) of HepG2 mtDNA which was digested with 2U of BamHI overnight at 37°C and visualised on agarose gel (right panel). (C) Cytosine methylation compared to sequencing read depth (left panel) of HepG2 mtDNA that was fragmented via sonication (100–7000 bp) and visualized on agarose gel (right panel). (D) HepG2 sonicated mtDNA (left panel) and bisulfite modified mtDNA (right panel) was assessed on the BioAnalyser to ensure sonication was efficient and that modified mtDNA produced the standard expected curve. (E) Average number of reads aligning to the mitochondrial genome per 1000 bp. HepG2 sample that was sonicated prior to sequencing showed an improvement in coverage compared to the BamHI-treated HepG2 sample. (F) A 100% unmethylated plasmid DNA control was processed and sequenced alongside mtDNA samples to ensure an appropriate false positive threshold can be used for data analysis. The X-axis represents the genomic position of the plasmid genome (48 kb). The Y-axis represents the methylation value detected at each cytosine. The dots represent the 1.56% false detection rate.

