Figure 2.
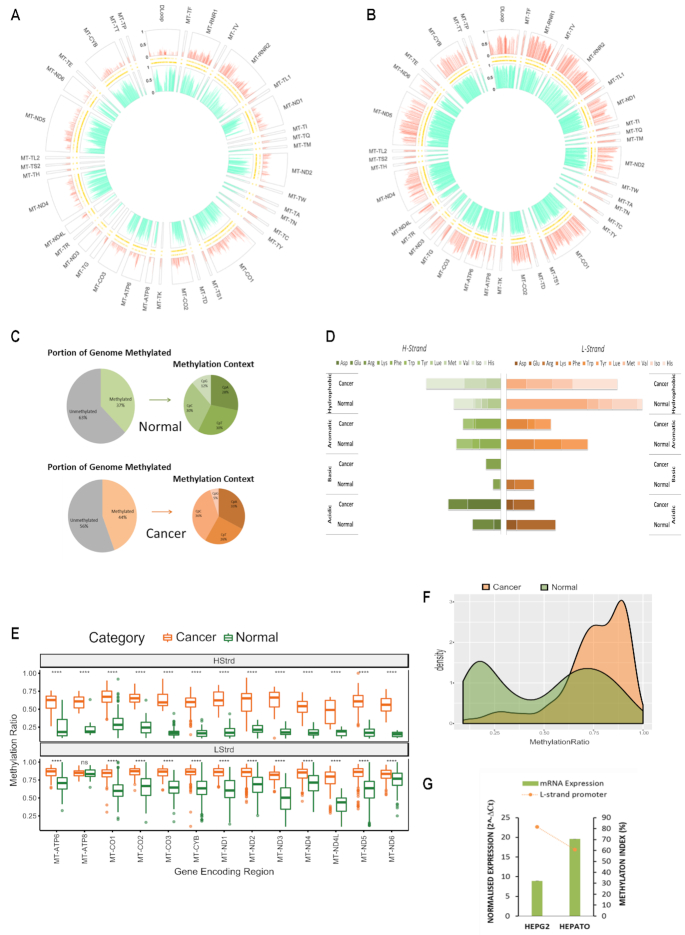
Baseline patterns of the mitochondrial methylome in normal and cancer liver cells. (A andB) MtDNA isolated from hepatocytes and liver cancer cells (HepG2) that was sequenced using the NSG MiSeq platform as described in Figure 1. The circular plot represents genomic position (1–16 kb) of all methylated cytosines with respect to sequence order. Each segment of the circle represents a separate functionally relevant region, tRNA, rRNA, gene or D-Loop. The Y-axis indicating that methylation level is represented on the left-hand side of the D-Loop segment. The large outer ring displays methylation at each cytosine within the H-Strand, whereas the large inner ring displays methylation at each cytosine on the L-Strand. Thin inner bands indicate the genomic position of all cytosines within the H-Strand and L-Strand sequence. Global mtDNA methylation patterns differ between hepatocytes and cancer cells and are also strand specific. (C) Summary statistics of the frequency of mitochondrial mCpN context in liver cells. (D) Methylation Index across tRNA encoding regions in liver cancer versus normal cells. Each horizontal segment compares the MI within tRNAs that have been grouped according to the amino acid they carry (acidic, basic, aromatic or hydrophobic). The left panel indicates MI across H-Strand and right panel indicates MI across L-Strand. (E) Comparative boxplots indicating significant (P < 0.001) difference of mean methylation across gene encoding regions of normal versus cancer cells in each strand. (F) Density plot of the distribution of methylation values along the D-Loop region. (G) Relative ND6 mRNA expression normalized to mtDNA amount compared with methylation index across the LSP. High LSP methylation associates with low ND6 expression.

