Figure 4.
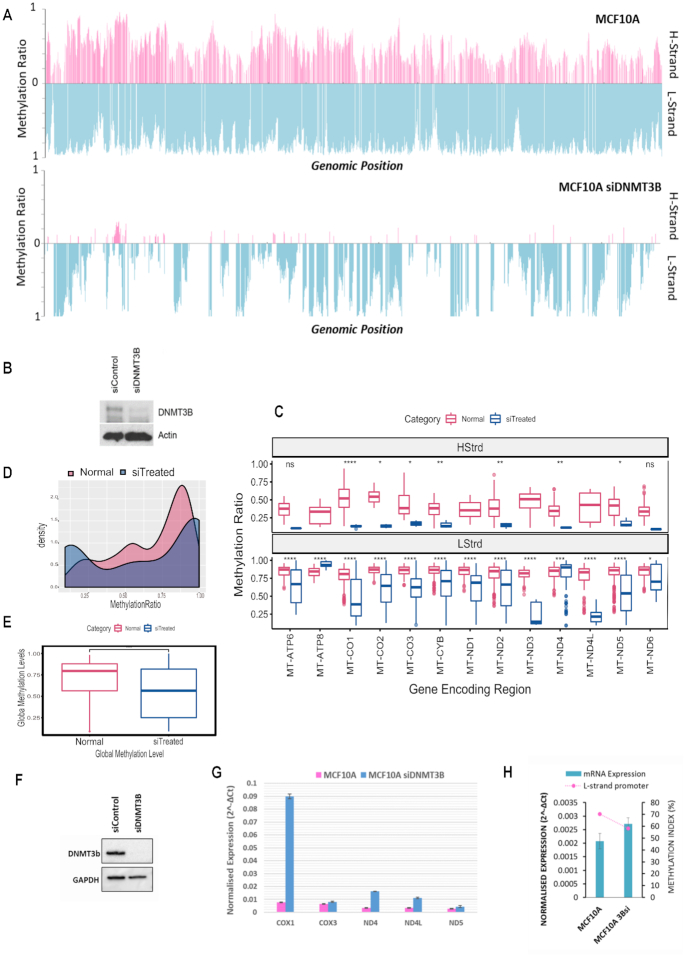
Silencing DNMT3B modulates mitochondrial DNA methylation concomitant to expression changes of mitochondrial transcripts. (A) MtDNA methylation in MCF10A cells exposed to a 96-h treatment of DNMT3B siRNA compared to control. A global drop in methylation ratio is observed for H and L strand methylation in DNMT3Bsi treated cells. (B) Whole cell protein was assayed for relative amounts of DNMT3B via western blot to confirm assay efficiency. (C) Comparative boxplot indicating significant (P < 0.001) difference of mean methylation across gene encoding regions of control versus knockdown treated cells in each strand. (D) Paired Wilcox t-test showing significance of the global drop in methylation between control and treated cells (P < 0.001). (E) Density plot of the distribution of methylation values along the D-Loop region. (F) Whole cell protein of repeat experiment assayed for relative amounts of DNMT3B via western blot to confirm efficiency. (G) Relative mRNA expression normalized to mtDNA amount compared of genes encoded on the H-strand. Treated cells show an increase in gene expression compared to control. (H) Relative ND6 mRNA expression normalized to mtDNA amount compared with methylation index across the LSP. High LSP methylation associates with low ND6 expression.

