Figure 1.
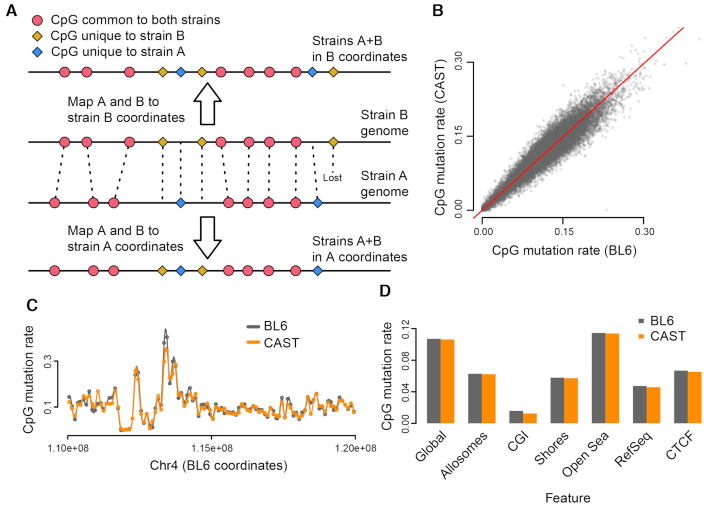
Characteristics of strain-specific CpG mutations. (A) A representation of whole-genome alignment between two strains, A and B. The CpGs present in the two strains can be represented in both coordinate systems; CpGs are either shared between strains (red), mutated (yellow or blue) or ‘lost’ due to indels that render the coordinate unmappable (rightmost yellow). (B and C) The CpG mutation rate (proportion of strain-specific CpGs relative to total CpGs) calculated in 100 kb bins, is comparable between BL6 and CAST strains, both genome-wide (B) and locally (C). (D) The CpG mutation rate across different genomic features.

