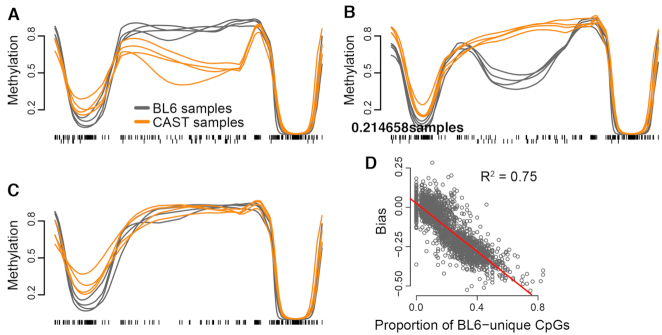
Figure 3.
Quantification bias causes false-positive focal methylation changes. The example region pictured in (A) is identified as a DMR in mm9-aligned analysis, due to multiple BL6-unique CpGs (downwards ticks) that are read as having near-0% methylation in CAST samples. The DMR is reversed in direction if all samples are aligned to CAST due to the same effect occurring with CAST-unique CpGs (B), and no differential methylation is observable once these sites are removed from analysis (C). The magnitude of bias in such false-positive DMRs (i.e. the change in apparent differential methylation when unique CpGs are removed) is highly correlated with the regional level of CpG variation (C).

