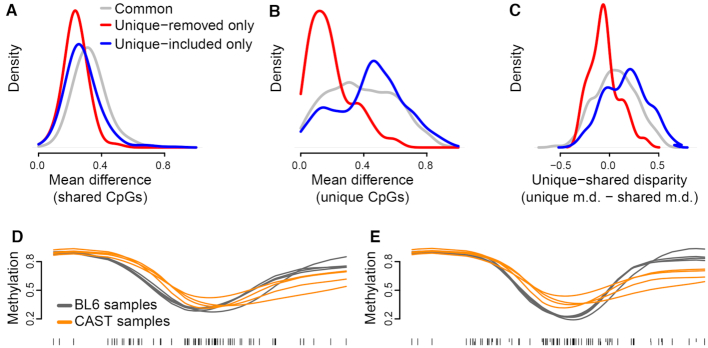
Figure 4.
Including strain-unique CpGs identifies additional DMRs in focal analysis. (A) A density of the mean methylation differences across three sets of DMRs. For each DMR, the mean methylation difference was computed using unsmoothed methylation values for CpGs present in both strains. (B) Like (A) but the mean difference is computed only using CpGs unique to either strains. (C) A density of the difference between the mean methylation differences in (B) and (A). (D and E) An example DMR chosen from those only identified in the unique-included analysis shows no observable difference between strains in the unique-removed analysis (D) but a larger difference in the unique-included analysis (E).

