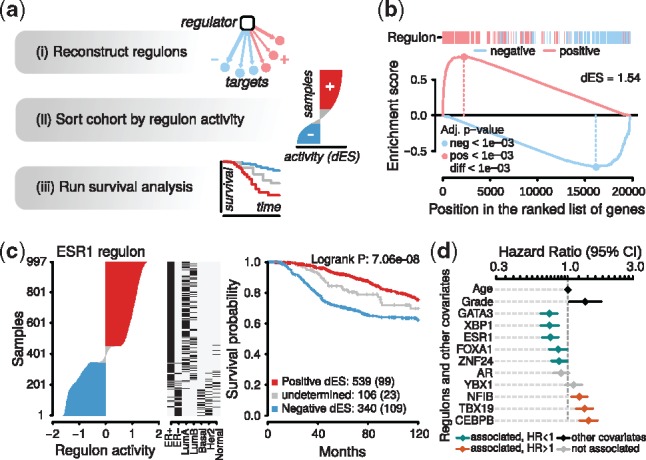
Fig. 1.

RTNsurvival pipeline and results. (a) Overview of the pipeline. Given a regulatory network from RTN, RTNsurvival calculates RAPs, which are used to stratify samples for a Kaplan-Meier analysis, or to fit a Cox Proportional Hazards model, including confounding variables. In (b), we show the GSEA-2T regulon activity calculation for sample MB-5365, the luminal A tumour in the METABRIC cohort that has the most-activated ESR1 regulon. The MB-5365 transcriptome is enriched with induced ESR1-positive targets and enriched with repressed ESR1-negative targets. The ‘dES’ score quantifies regulon activity in this sample; GSEA-2T returns one dES per regulon per sample. (c) A covariate and survival analysis for the ESR1 regulon. In the left panel, samples are ranked and stratified according to ESR1 regulon activity. The centre panel adds covariates, and shows that samples with higher ESR1 activity were also found to be ER+ in immunohistochemical assays; such patients were more likely to receive hormone therapy. In the right panel, Kaplan-Meier curves are plotted for the 3 strata. (d) A forest plot generated by a multivariate RTNsurvival analysis showing hazard ratios derived from regulon activity for selected regulons, with age and tumour grade
